Tuesday, December 10, 2013
Sunday, November 24, 2013
Sustainable Economics: A Response to Post by Jo Confino, Executive Editor of The Guardian on Need for a Compelling Future Vision for Sustainability to Progress
Short Piece Written in Comments Section in Response to Post by Jo Confino, Executive Editor of the Guardian, titled: "Sustainability movement will fail unless it creates a compelling future vision"
Ultimately, to survive, everything thing we do will have to
be sustainable. Everything. Throughout history, societies have faced
calamities, to which their collective response made all the difference between
survival or collapse. In most cases,
societies were unable to perceive much less respond to their inherent
unsustainable ways of living, such as the Mayans, Easter Island or the Anasazi. Their societies were based on unsustainable
and precarious systems of life support tied to the environment. In some cases, challenges have been recognized
and addressed, by perceptive and strong governments which was able to identify the problem and implement solutions.
The Japanese in the 17th century were faced with extraordinary
challenge of galloping deforestation. The
government instituted policies including using less wood for construction,
putting in more efficient heating stoves, and switched to coal from wood for
heating. Japan is currently about 70% forested. In a more recent century, the world did come together to address
CFC’s.
As seen in the United States and Europe, our carbon
emissions have come down over the past five years. Some may say we have exported our carbon
emissions to Asian countries. That can
account for some of the change, but it is also important to look at reduced
miles being driven, higher efficiency of cars, the switch to lower carbon
natural gas from coal in the United States, and the growth in renewable sources
of energy in Europe and the United States.
The US and European economies are responding to higher oil prices, which
has reduced the level of economic activity and reduced deleterious
environmental impacts. This provides a
clue to our future and solving the problem in two respects. First, economies of advanced countries do
have a higher elasticity of oil price to demand than Asian countries. Second, higher oil prices result in lower
levels of economic activity, increased efficiency, and reduced environmental
impacts. The earth is telling us to cut
back on energy, and we are. The pace of
the cut back may not be as steep a glide slope as what is sought, warranted or
needed. The implication is that we need
to do something to (1) steepen the glide slope in developed
economies; (2) reverse emissions growth in developing countries; and (3)
address severe economic and well-being inequities around the world.
Governments will play a critical and pivotal role in
turning the tide towards and accelerating the move towards a more sustainable
economy. The challenge with a capitalist
system, well established in the literature and through practice, is the
frequent absence of externalities, short time frame decision horizons, and
boundary conditions that do not address social issues such as global inequity. Nation states have a hard time being first, to take the lead on tackling large issues. The move to
address deforestation in the United States, for example, began with State and
regional initiatives to set aside parkland in the early 20th
century. We can also see more recent
examples of localization of environmental initiatives with RGGI in the
Northeast, the carbon trading initiative in California, and the implementation
of renewable energy standards in selected states, representing just a few of many excellent examples.
Ultimately, realizing a sustainable economy is in the
interest of business, governments and individuals. Without sustainable resources, economic decline, which has already begun, is inevitable, and will be inexorable and painful. Forestalling initiatives
which align our policies and investments to be consistent with a move to a
sustainable economy is not in our best interest. Having a
sustainable economy is not inconsistent with our economic interests, in
fact, ultimately it is 100% consistent. This
central tenant, that increased sustainability and increased economic well-being
are one and the same, may perhaps be that new paradigm people are looking
for. The interests of sustainability and
economics are not at cross-purposes, but are of one. Any society, any collective peoples
throughout time, who did not own and embed sustainability within their societies and cultures, did not survive.
Where does this unified theory of sustainability and
economics come from? Two
perspectives. One, mentioned earlier, is
understanding the history of societies that collapsed. The second is through understanding the
source of economic activity within our own economies, and extrapolating the
future risks our economy carries without integrating concepts of sustaining the
economy going forward.
The global economy has grown to an extraordinary degree over
the past several hundred years, tied to the level of energy entering the
economy. The level of economic activity is
explained by two things: one being the level of energetic inputs entering the
economy, and the second being the level of efficiency and productivity to which
those resources are put. Energy plus
Efficiency. If we want to grow our
economy, we have two choices, increase the amount of energy resources being
consumed, and/or increase efficiency and productivity. This is a very interesting finding, given
that we can have a growing economy with a static level of energy resources
entering the economy, as long as we improve the efficiency of resource
utilization. Second interesting finding
is that if we can economically migrate our energy systems away from
nonrenewable to renewable resources, while keeping energy use static and
improving efficiency, we can once again have a growing economy while
simultaneously reducing deleterious environmental impacts.
The cost of energy, however, plays an important role on our
level of economic activity. Higher
energy costs mean a lower level of economic activity, constrained by efficiency
improvements. If sustainable sources of
energy are a lot more expensive than non-renewable, then we will see a lowering
of economic activity. The pace of the
transition will be governed by the relative economics of the alternatives, and
the degree of incentives required to level the economic playing field, and the
pace of capital formation and its availability.
Fortunately, the economics of renewable energy are getting close to
being competitive without subsidies, with costs continuing to move down over
time with scale economies and continuous improvement. So what is the process to make this happen?
(1) Build a specific vision of where we want to be and when
in terms of sustainability. For example,
80% sustainable in 40 years. Great
detail and specificity by sector, end-use, activity, etc. is highly
recommended. (2) Identify specific performance metrics to track performance
along the way, such as proportion of renewable energy on the grid,
transportation, heating, etc. (3) Implement market incentives to encourage
private capital to make investments. Put
a price on carbon, set up carbon caps with trading, keep CAFÉ going, eliminate
subsidies on non-sustainable resources, reduce transition and market barriers
where possible, expand RPS requirements to every state, implement stretch and
zero net energy building codes in every jurisdiction in the country, implement
net metering tariffs in every state, increase CHP incentives, invest in
expanded public transit, etc. (4) Implement government initiatives to
transition government faster than private markets. (5) Expand incentives and
reduce market barriers for investments in energy efficiency and
productivity. (6) Incentivize investments
in technology innovation tied to renewable energy and efficiency and
productivity.
The prescriptive set of activities identified above are no
surprise to anyone involved in accelerating our transition to a sustainable
economy. The effort to adopt these steps
has to take place throughout society, to build a groundswell of activity that
is sound and impactful, building up from the local, state and regional levels
to the national and international level.
Significant progress has been made in specific sectors and in specific
countries, such as Denmark with wind, German with Energiewende, and Texas with
wind power. There are many more
examples, including renewable fuels and efficiency, but the pace has to
increase and the efforts have to expand.
Wednesday, November 13, 2013
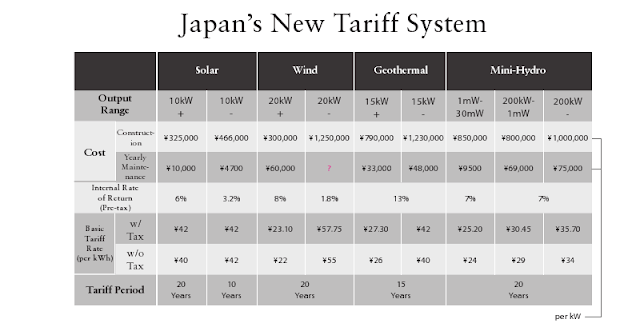
Japan's Solar Feed-in Tariff (FIT) Worth An Astounding $3.15/watt!
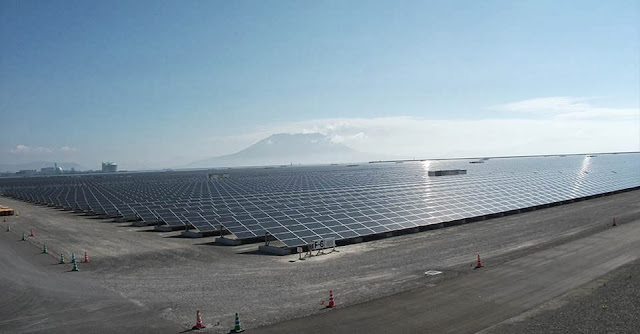
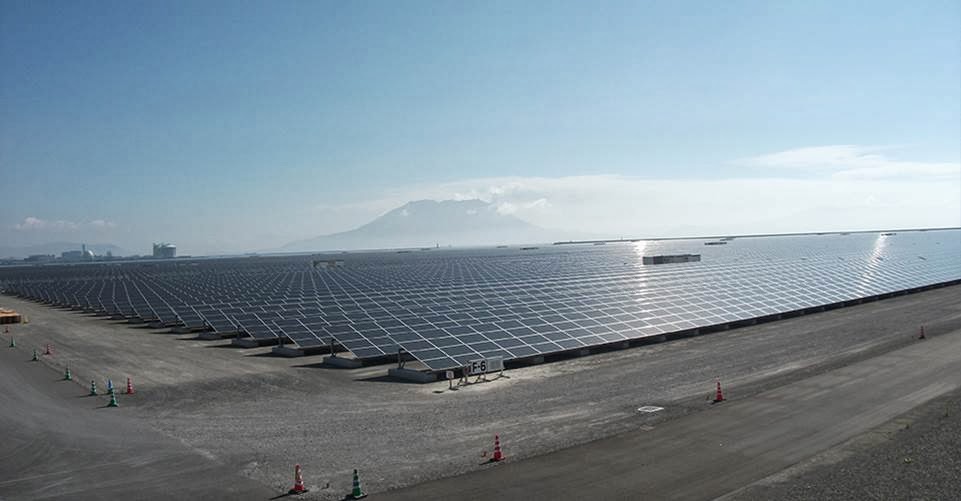
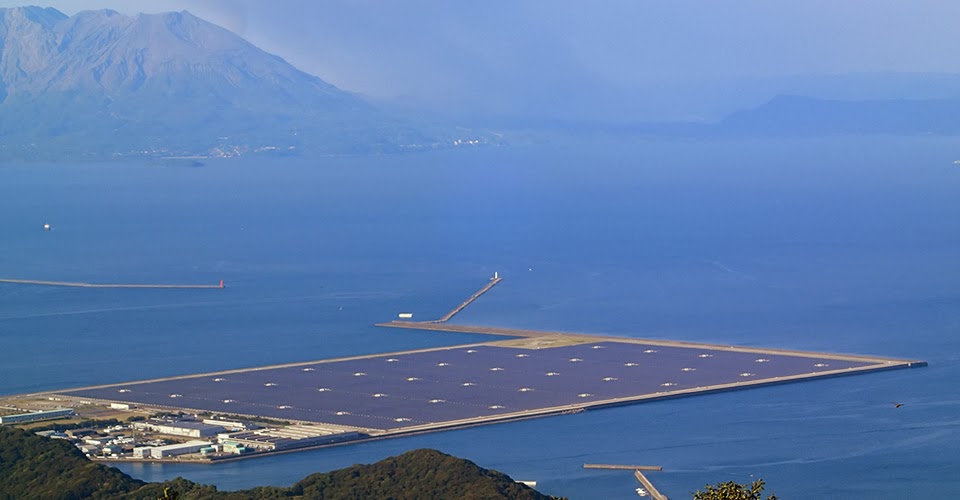
Japan implemented a significantly generous solar feed in tariff, equivalent to $0.42/kWh for 20 years. It is expected that this will result in every available inch of available land being deployed with solar until there is no land available. One innovation is the newly opened 70 MW Kyocera solar plant, which covers 315 acres of land filled in a shallow area off the coast of Japan.
The present value of the solar FIT is equivalent to $3.15/watt, which exceeds the fully loaded installed system price. Hence, we are going to see an unprecedented boom in solar deployment in Japan over the next few years.
Below is Japan's tariff schedule for renewable energy along with several photographs of the Kyocera plant..

Monday, November 11, 2013
JAPAN STARTS UP OFFSHORE WIND FARM NEAR FUKUSHIMA
Source: Associated Press
— Nov. 11, 2013 5:27 AM EST

— Nov. 11, 2013 5:27 AM EST
ONAHAMA PORT, Japan (AP) — Japan switched on the first turbine at a wind farm 20 kilometers (12 miles) off the coast of Fukushima on Monday, feeding electricity to the grid tethered to the tsunami-crippled nuclear plant onshore.
The wind farm near the Fukushima Dai-Ichi nuclear power plant is to eventually have a generation capacity of 1 gigawatt from 143 turbines, though its significance is not limited to the energy it will produce. Symbolically, the turbines will help restore the role of energy supplier to a region decimated by a population exodus following the multiple meltdowns triggered by the March 2011 earthquake and tsunami.
"Many people were victimized and hurt by the accident at the Fukushima Dai-Ichi nuclear power plant, so it is very meaningful to have a new source of energy — renewable energy — based here," said Kazuyoshi Akaba, a vice minister of economy, trade and industry, after the turbine was turned on.
"It is the government's mission to ensure this project is a success," he said.
The project also highlights Japan's aspirations to sell its advanced energy technology around the globe.
Trading houses such as Marubeni Corp., which is leading the consortium building the offshore wind farm, are investing aggressively in renewable energy as well as conventional sources, helped by government policies aimed at nurturing favored industries.
All of Japan's 50 viable nuclear reactors are offline for safety checks under new regulatory guidelines drawn up after the Fukushima disaster. Utility companies have applied to restart at least 14 reactors under those new guidelines, which include more stringent requirements for earthquake and tsunami protections, among other precautions.
In Japan, the push to tap more renewable sources to help offset lost power capacity, and reduce costs for imported natural gas and oil, also got a boost last year with the implementation of a higher wholesale tariff for energy generated from non-conventional sources.
Japan, whose coast is mostly ringed by deep waters, is pioneering floating wind turbine construction, required for seabed depths greater than 50 meters (165 feet). The 2 megawatt downwind floating turbine that began operation Monday was built at a dry dock near Tokyo and towed to its location off the northeastern coast. Six huge chains anchor it to the seabed 120 meters (almost 400 feet) below.
The turbine is linked to a 66 kilovolt floating power substation, the world's first according to the project operators, via an extra-high voltage undersea cable.
As the government and Tokyo Electric Power Co. struggle to clean up from the nuclear disaster and begin the decades-long task of decommissioning Fukushima Dai-Ichi, Japan's energy industry is in the midst of a transition whose outcome remains uncertain.
Most leading members of Japan's ruling Liberal Democratic Party and the powerful business lobbies such as Keidanren, and many experts, argue that wind and other renewables alone simply cannot make up for the steady and huge baseload power produced by nuclear plants.
"I favor renewables. But it would be irresponsible to create a pie-in-the-sky claim that renewables alone are the answer," said Paul Scalise, a fellow at Tokyo University and expert on Japan's energy industry. "There is no such thing as a perfect power source."
He cites figures showing wind power's average generating capacity at 2 watts per square meter versus 20 watts per square meter for solar power — and 1,000 watts per square meter for nuclear.
Eventually there could be dozens of wind turbines off Fukushima's scenic but deserted coast. The project is meant to demonstrate the feasibility of locating these towering turbines in offshore regions where the winds are more reliable and there are fewer "not in my backyard" concerns. Bigger turbines that might create noise problems onshore are not an issue so far offshore.
Yuhei Sato, the governor of Fukushima Prefecture who has lobbied hard for support following the 2011 disasters, said he expected local businesses to benefit from the wind farm. A research center is planned for Koriyama, a city further inland, and studies are underway on the impact of local fisheries from the floating turbines.
"We are moving ahead one step at a time. This wind farm is a symbol of our future," Sato said.
In theory, Japan has the potential for 1,600 gigawatts of wind power, most of it offshore. About a dozen projects are already in the works, from Kyushu in the south to Hokkaido in the north.
But wind power can be notoriously unstable: when the switch was pushed to "on" on Monday, the audience of VIP officials watched tensely as the wind turbine's blades, displayed on a video screen at a tourist center onshore, appeared becalmed. Eventually, though, the blades slowly began rotating.
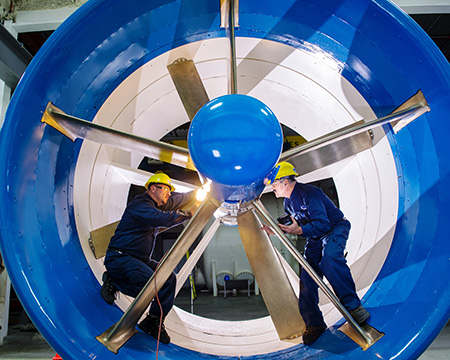
Boeing to Deploy 9 MW of In-River Turbines with RER Hydro in Montreal
Boeing and RER Hydro to Provide Quebec with Clean Hydrokinetic Power
"This agreement between industry and government will deliver renewable power while protecting the environment," said Boeing Defense, Space & Security President and CEO Dennis Muilenburg. "It also builds on Boeing's long-term, strategic partnership with Canada, supporting customers from aerospace and defense to clean energy, generating high-quality jobs, and making a difference in the community."
Imad Hamad, RER’s chief executive officer, added that "Because it’s not a dam, the turbines generate clean power without disrupting the river flow or the natural habitat. Numerous independent studies demonstrate that our technology has no negative impact on fish or other marine life."
This agreement is the first commercial sale of this technology. RER, which has been testing a prototype in the river for more than three years, will build the turbines in its new manufacturing plant here, thus creating the world's first river hydrokinetic manufacturing base in Quebec.
Boeing and RER signed an agreement last year giving Boeing exclusive rights to market and sell the turbines around the world. Boeing is providing program management, engineering, manufacturing, and supplier-management expertise, in addition to servicing the turbines. Boeing currently works with 40 suppliers in Quebec, contributing to the $1 billion in economic revenue Boeing generates annually across Canada.
As a leading developer of ecologically minded hydrokinetic harvesting solutions that preserve free-running rivers and their ecosystems, RER Hydro Ltd. has successfully created a cost-effective and environmentally friendly technology that requires minimum civil works and has no negative ecological impacts. The TREK (Kinetic Energy Recovery Turbine) technology is an innovative, proven solution that allows for the large-scale harnessing of the vast hydrokinetic energy available in rivers across the world.
Contact:
Miriam Djebbar
Agreement marks the 1st commercial sale of hydrokinetic turbines
Source: Boeing Company Press Release
BECANCOUR, Quebec, Nov. 11, 2013 -- Boeing [NYSE: BA] and
its partner RER Hydro of Montreal have entered into a multiyear agreement with
the government of Quebec to provide 40 hydrokinetic turbines that will generate
about 9 megawatts of clean, renewable power.
Once completed, the St. Lawrence River near downtown
Montreal will have the world’s largest river-generated, hydrokinetic turbine
farm.
"This agreement between industry and government will deliver renewable power while protecting the environment," said Boeing Defense, Space & Security President and CEO Dennis Muilenburg. "It also builds on Boeing's long-term, strategic partnership with Canada, supporting customers from aerospace and defense to clean energy, generating high-quality jobs, and making a difference in the community."
Imad Hamad, RER’s chief executive officer, added that "Because it’s not a dam, the turbines generate clean power without disrupting the river flow or the natural habitat. Numerous independent studies demonstrate that our technology has no negative impact on fish or other marine life."
This agreement is the first commercial sale of this technology. RER, which has been testing a prototype in the river for more than three years, will build the turbines in its new manufacturing plant here, thus creating the world's first river hydrokinetic manufacturing base in Quebec.
Boeing and RER signed an agreement last year giving Boeing exclusive rights to market and sell the turbines around the world. Boeing is providing program management, engineering, manufacturing, and supplier-management expertise, in addition to servicing the turbines. Boeing currently works with 40 suppliers in Quebec, contributing to the $1 billion in economic revenue Boeing generates annually across Canada.
As a leading developer of ecologically minded hydrokinetic harvesting solutions that preserve free-running rivers and their ecosystems, RER Hydro Ltd. has successfully created a cost-effective and environmentally friendly technology that requires minimum civil works and has no negative ecological impacts. The TREK (Kinetic Energy Recovery Turbine) technology is an innovative, proven solution that allows for the large-scale harnessing of the vast hydrokinetic energy available in rivers across the world.
A unit of The Boeing Company, Boeing Defense, Space &
Security is one of the world's largest defense, space and security businesses
specializing in innovative and capabilities-driven customer solutions, and the
world's largest and most versatile manufacturer of military aircraft.
Headquartered in St. Louis, Boeing Defense, Space & Security is a $33
billion business with 58,000 employees worldwide. Follow us on Twitter:
@BoeingDefense.
# # #
B-roll video is available to the media through the contacts
below.
Contact:
Robert Sterling
Ventures
Boeing Defense, Space & Security
Office: +1 314-233-1816
Mobile: +1 314-681-3463
robert.sterling2@boeing.com
Miriam Djebbar
RER Hydro
Office: +1 514-685-8735 ext. 7410
Mobile: +1 514-267-4526
miriam.djebbar@rerhydro.comSaturday, November 2, 2013
Energy Prices Have Doubled in 15 Years, Imperilling Future Economic Growth and Prosperity
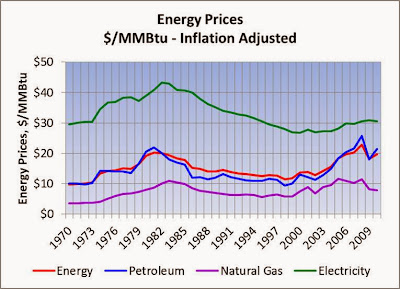
There are several points to make about energy prices. First, energy prices in the United States, based on all forms of energy at the retail level, reached their peak in 2007, at $22.79/MMBtu. Second, by 2010, energy prices had fallen 13% below the peak, and, in 2013, are heading back up. Prices in the chart below are expressed in inflation adjusted 2011 dollars.
A third point is that overall energy prices track petroleum prices very closely, demonstrating the enduring dominance of petroleum in our economy. Sustained high prices for energy in our economy are impinging on overall economic activity and employment. In 2013, energy prices are nearly twice what they were in the 1990's.
 Our energy picture presents a fundamental challenge for the country's long term economic growth and prosperity. As has been presented in earlier blog posts, overall employment in the United States is 98% explained by energy use and petroleum prices. The great recession of 2008 caused a downdraft in employment, with a return to pre-recession levels not likely to take place until 2018.
Petroleum remains a significant force and commanding presence in our economy. Petroleum prices appear to drive overall energy prices in the economy. Our ability as a nation to influence petroleum prices has slipped from our grasp, with emerging countries such as India and China driving up and sustaining high levels of global oil demand. It has also been discovered that Asian countries have a lower elasticity of demand to price compared to developed countries. Asian countries, in other words, are more resilient to high prices than in the United States. The implication is that we are captive to market forces acting on petroleum beyond our control.
In addition to a loss of our ability to influence oil prices to our favor, it appears that we have also entered a new higher energy price plateau that has caused our economic fortunes to dim. Higher energy costs have caused demand to be tempered along with a reduction in economic activity. To sustain the economy requires reducing energy costs, increasing energy use and increasing energy efficiency and productivity.
Creating a more robust, resilient, equitable and sustainable economy can be accomplished, although it won't be without its challenges. To have a growing economy, even at moderate growth rates, requires a combination of low cost energy, increased energy consumption, and continuous improvement in energy efficiency and productivity. To regain control over our economic future, to unshackle ourselves from the vagaries of foreign markets and their associated high demand and high price regime, requires increasing the mix of less volatile and domestic sources of energy.
Petroleum and equivalent liquid energy products constitute approximately 36% of our energy use in the United States. This points to the great utility of petroleum and equivalent liquid fuels, which is difficult to replace or find substitutes. Significant efforts have been expended to produce liquid fuels, including ethanol and other biomass based liquid fuels. These efforts have been challenging due to poor energy balances and high costs. In addition to trying to alternative liquid fuels, significant efforts are underway to increase transportation efficiency with hybrids and other technologies, and introduce alternative fuel vehicles, considering electric cars and hydrogen vehicles. All of these technologies are expensive, may have performance challenges, and can require significant infrastructure investments. Finding a lower cost alternative to petroleum with equal or better utility is one of the most difficult challenges facing our economic future and well being.
The boom in natural gas in the United States has been quite beneficial to the economics of electricity generation and reducing the country's carbon emissions. The cost to produce a kilowatt-hour with natural gas in late 2013 is approximately 30% less than the cost to produce an equivalent kilowatt-hour from coal. This is due principally to the significant increase in natural gas production due to fracking, which in 2013 accounts for approximately 28% of the natural gas supply in the United States. The increase of natural gas supply drove prices down, with coal plants becoming uneconomic as a result.
For electricity production, the United States has shifted towards cleaner lower cost natural gas, and seen relatively significant increases in renewable energy, including wind turbines and solar power. The economics of both wind and solar have improved dramatically over this time period as well, with wind competitive with coal and the solar becoming competitive in extremely large deployments in sunny Western states.
The addition of renewables to the German grid, for example, are wreaking havoc on standard utility economics, in new and unexpected ways. Renewables are capital intensive and have zero fuel (marginal) costs. In a standard utility economic model, wholesale generation prices are set by the marginal cost to produce the last kilowatt hour in each hour. Grid operators dispatch generation resources using a system called economic dispatch, dispatching the lowest cost power plants first. Baseload powre plants have typically been nuclear power plants and coal plants, which had the lowest marginal operating costs and basically ran most of the time. Next up historically, covering the shoulder portion of the demand curve, would have been natural gas power plants.
Historically, heat rates and fuel costs for natural gas plants placed them at an economic disadvantage to coal plants. With the advent of fracking, driving down natural gas costs, and continuous improvement in the efficiency and heat rates of natural gas power plants, especially combined cycle combustion turbines, gas plants are have lower marginal costs than coal plants in the United States. As such, natural gas plants are displacing coal plants in the economic dispatch order in the United States. For several hundred hours per year, when the highest demand occurs, grid operators typically dispatch the highest marginal cost plants, including oil and diesel power plants.
Wholesale generators are compensated for their electricity production applying the marginal rate in each hour to all electricity produced in that hour. Based on historic patterns, this approach has been understood, and investments in generation assets have been based on this economic construct to cover plant fuel, O&M and capital costs. This economic paradigm, in place for decades, however, is going through a radical and disruptive change, with the introduction of non-dispatchable zero marginal cost renewables, and the introduction of demand side / distributed generation resources.
In locations as diverse as Germany and Texas, with independent grids and high penetration of renewable resources, grid economics have been upended. At times, on both grids, negative wholesale pricing was used to discourage power production. This occurred at times when non-dispatchable renewables were operating at full blast, typically a very windy period, and demand for power on the grid was at a low point, typically at night. In addition to negative pricing, grid operators also shut renewable plants down. The effective of negative pricing impacts both renewable and conventional power economics.
In Germany, the low marginal cost of renewable power is being applied as the basis for compensation for conventional power plants. In addition, the operating hours of natural gas plants are being cut back with the increased generation by renewable power. Renewable power plants are given preference on dispatch, to the chagrin of conventional power plants. The earnings of power companies in Germany have been significantly reduced. E.ON AG, for example, is suffering reduced earnings year over year, with a loss reported in the third quarter of 2013. It attributes the losses to poor economic performance of natural gas resources and the priority given to renewable power.
The economic impact of renewable power is disruptive in two ways. First, renewable power plants are allowed to operate when the wind blows and when the sun shines, given preference on operation over other resources. This cuts into the operating hours of standard power plants, reducing their capital cost coverage ratios. The second impact is the reduction in marginal costs applied to conventional power plants. Renewables are shifting marginal costs downward at times which were at once higher cost regimes on the dispatch curve. this is reducing the revenues for conventional power plants, hurting their economics.
The other area of concern to utility companies is the devolvement of customer energy demand associated with expanding distributed generation, increased efficiency and greater demand response, all of which reduce utility revenues. The combination of solar power, fuel cells and improved efficiency reduce the revenues associated with customers that implement energy reduction initiatives. As such, there are fewer kilowatt-hours sold, and fewer kilowatt-hours to spread fixed costs of operating utilities. As a result, utilities have to increase the rates they charge for electricity, to compensate for fewer electrons being sold. The customers that have taken advantage of solar and efficiency incentives, increasing electric rates have less of an impact than those customers that have not improved their efficiency or reduced their load through distributed generation.
As rates go up, and efficiency and distributed generation costs go down, incentives to switch away from the utility increase, and more and more customers will further reduce their electricity purchases from monopoly utilities. In many parts of the United States, utility companies have already had to abandon their generation business, focusing on transmission and distribution. Many utilities are investor owned utilities, with their capital sourced through public capital markets. As their revenue models are called into question, and electric revenues are flat or declining, utilities may hit tipping points, where regulators won't support ever increasing electric rates applied to dissipating electric sales. At that point, investors may run for the exists, destroying the IOU utility compact put in place nearly a century ago. This is getting interesting.
A third point is that overall energy prices track petroleum prices very closely, demonstrating the enduring dominance of petroleum in our economy. Sustained high prices for energy in our economy are impinging on overall economic activity and employment. In 2013, energy prices are nearly twice what they were in the 1990's.

Petroleum remains a significant force and commanding presence in our economy. Petroleum prices appear to drive overall energy prices in the economy. Our ability as a nation to influence petroleum prices has slipped from our grasp, with emerging countries such as India and China driving up and sustaining high levels of global oil demand. It has also been discovered that Asian countries have a lower elasticity of demand to price compared to developed countries. Asian countries, in other words, are more resilient to high prices than in the United States. The implication is that we are captive to market forces acting on petroleum beyond our control.
In addition to a loss of our ability to influence oil prices to our favor, it appears that we have also entered a new higher energy price plateau that has caused our economic fortunes to dim. Higher energy costs have caused demand to be tempered along with a reduction in economic activity. To sustain the economy requires reducing energy costs, increasing energy use and increasing energy efficiency and productivity.
Creating a more robust, resilient, equitable and sustainable economy can be accomplished, although it won't be without its challenges. To have a growing economy, even at moderate growth rates, requires a combination of low cost energy, increased energy consumption, and continuous improvement in energy efficiency and productivity. To regain control over our economic future, to unshackle ourselves from the vagaries of foreign markets and their associated high demand and high price regime, requires increasing the mix of less volatile and domestic sources of energy.
Petroleum and equivalent liquid energy products constitute approximately 36% of our energy use in the United States. This points to the great utility of petroleum and equivalent liquid fuels, which is difficult to replace or find substitutes. Significant efforts have been expended to produce liquid fuels, including ethanol and other biomass based liquid fuels. These efforts have been challenging due to poor energy balances and high costs. In addition to trying to alternative liquid fuels, significant efforts are underway to increase transportation efficiency with hybrids and other technologies, and introduce alternative fuel vehicles, considering electric cars and hydrogen vehicles. All of these technologies are expensive, may have performance challenges, and can require significant infrastructure investments. Finding a lower cost alternative to petroleum with equal or better utility is one of the most difficult challenges facing our economic future and well being.
The boom in natural gas in the United States has been quite beneficial to the economics of electricity generation and reducing the country's carbon emissions. The cost to produce a kilowatt-hour with natural gas in late 2013 is approximately 30% less than the cost to produce an equivalent kilowatt-hour from coal. This is due principally to the significant increase in natural gas production due to fracking, which in 2013 accounts for approximately 28% of the natural gas supply in the United States. The increase of natural gas supply drove prices down, with coal plants becoming uneconomic as a result.
For electricity production, the United States has shifted towards cleaner lower cost natural gas, and seen relatively significant increases in renewable energy, including wind turbines and solar power. The economics of both wind and solar have improved dramatically over this time period as well, with wind competitive with coal and the solar becoming competitive in extremely large deployments in sunny Western states.
The addition of renewables to the German grid, for example, are wreaking havoc on standard utility economics, in new and unexpected ways. Renewables are capital intensive and have zero fuel (marginal) costs. In a standard utility economic model, wholesale generation prices are set by the marginal cost to produce the last kilowatt hour in each hour. Grid operators dispatch generation resources using a system called economic dispatch, dispatching the lowest cost power plants first. Baseload powre plants have typically been nuclear power plants and coal plants, which had the lowest marginal operating costs and basically ran most of the time. Next up historically, covering the shoulder portion of the demand curve, would have been natural gas power plants.
Historically, heat rates and fuel costs for natural gas plants placed them at an economic disadvantage to coal plants. With the advent of fracking, driving down natural gas costs, and continuous improvement in the efficiency and heat rates of natural gas power plants, especially combined cycle combustion turbines, gas plants are have lower marginal costs than coal plants in the United States. As such, natural gas plants are displacing coal plants in the economic dispatch order in the United States. For several hundred hours per year, when the highest demand occurs, grid operators typically dispatch the highest marginal cost plants, including oil and diesel power plants.
Wholesale generators are compensated for their electricity production applying the marginal rate in each hour to all electricity produced in that hour. Based on historic patterns, this approach has been understood, and investments in generation assets have been based on this economic construct to cover plant fuel, O&M and capital costs. This economic paradigm, in place for decades, however, is going through a radical and disruptive change, with the introduction of non-dispatchable zero marginal cost renewables, and the introduction of demand side / distributed generation resources.
In locations as diverse as Germany and Texas, with independent grids and high penetration of renewable resources, grid economics have been upended. At times, on both grids, negative wholesale pricing was used to discourage power production. This occurred at times when non-dispatchable renewables were operating at full blast, typically a very windy period, and demand for power on the grid was at a low point, typically at night. In addition to negative pricing, grid operators also shut renewable plants down. The effective of negative pricing impacts both renewable and conventional power economics.
In Germany, the low marginal cost of renewable power is being applied as the basis for compensation for conventional power plants. In addition, the operating hours of natural gas plants are being cut back with the increased generation by renewable power. Renewable power plants are given preference on dispatch, to the chagrin of conventional power plants. The earnings of power companies in Germany have been significantly reduced. E.ON AG, for example, is suffering reduced earnings year over year, with a loss reported in the third quarter of 2013. It attributes the losses to poor economic performance of natural gas resources and the priority given to renewable power.
The economic impact of renewable power is disruptive in two ways. First, renewable power plants are allowed to operate when the wind blows and when the sun shines, given preference on operation over other resources. This cuts into the operating hours of standard power plants, reducing their capital cost coverage ratios. The second impact is the reduction in marginal costs applied to conventional power plants. Renewables are shifting marginal costs downward at times which were at once higher cost regimes on the dispatch curve. this is reducing the revenues for conventional power plants, hurting their economics.
The other area of concern to utility companies is the devolvement of customer energy demand associated with expanding distributed generation, increased efficiency and greater demand response, all of which reduce utility revenues. The combination of solar power, fuel cells and improved efficiency reduce the revenues associated with customers that implement energy reduction initiatives. As such, there are fewer kilowatt-hours sold, and fewer kilowatt-hours to spread fixed costs of operating utilities. As a result, utilities have to increase the rates they charge for electricity, to compensate for fewer electrons being sold. The customers that have taken advantage of solar and efficiency incentives, increasing electric rates have less of an impact than those customers that have not improved their efficiency or reduced their load through distributed generation.
As rates go up, and efficiency and distributed generation costs go down, incentives to switch away from the utility increase, and more and more customers will further reduce their electricity purchases from monopoly utilities. In many parts of the United States, utility companies have already had to abandon their generation business, focusing on transmission and distribution. Many utilities are investor owned utilities, with their capital sourced through public capital markets. As their revenue models are called into question, and electric revenues are flat or declining, utilities may hit tipping points, where regulators won't support ever increasing electric rates applied to dissipating electric sales. At that point, investors may run for the exists, destroying the IOU utility compact put in place nearly a century ago. This is getting interesting.
Sunday, October 27, 2013
Whither Inflation? "Many Now Think Inflation Helps"
The New York Times reported on October 27, 2013, that "there is a growing concern inside and outside the Fed that inflation is not rising fast enough." On one level, this apparent policy pivot on the part of the Fed is surprising, given the Fed's long held and overarching aversion to any snippet of inflation in the economy. A second surprise is the idea that increasing inflation is a monetary policy tool available to our government to encourage economic growth. Third, it is also surprising that the Fed is considering inflation as an input into the economy, as opposed to a measure a a result of other economic forces.
In 1966, Alan Greenspan, a recent Chairman of the Federal Reserve, contributed to Ayn Rand's newsletter "Objectivist", writing "In the absence of the gold standard, there is no way to protect savings from confiscation through inflation." In his 18 years at the helm of the Fed, Greenspan's policies were on the side of an inflation hawk. Equally, although in a much different time, Paul Volcker was serenely focused on monetary supply and keeping inflation in check. One of his major efforts as Chairman of the Fed was the taming of the high inflation experienced in the early 1980's, triggering a recession to cool economic activity.
Volcker has also expressed his opinion in the past few years, expressing his concerns over potentially inflationary Fed policies. In November, 2010, he spoke in Singapore about his concerns over the potential emergence of inflation associated with quantitative easing policies being led by Ben Bernanke.
In 2011, Volcker wrote an Op-Ed in the New York Times, further expanding on his concerns about reduced vigilance against inflation on the part of the Federal Reserve and the Obama administration. He also recognized, however, the "desperation" that essentially all the fiscal and monetary tools have been exausted to no great effect, other than saving the economy from going off a cliff, but not leading to even a moderately robust recovery, writing:
"There is great and understandable disappointment about high unemployment and the absence of a robust economy, and even concern about the possibility of a renewed downturn. There is also a sense of desperation that both monetary and fiscal policy have almost exhausted their potential, given the size of the fiscal deficits and the already extremely low level of interest rates."
"Rather, the danger is that if, in desperation, we turn to deliberately seeking inflation to solve real problems — our economic imbalances, sluggish productivity, and excessive leverage — we would soon find that a little inflation doesn’t work."
Our current economic circumstance in the United States is quite troubling, with millions out of work, and job creation and incomes at levels abysmally short of prior levels and what people need and expect. The Obama administration did a remarkable job addressing the great recession, keeping the global economy and financial system from collectively going over the credit cliff. As it is, we are remain reeling from the effects of severe credit correction, with a economy wide shoring up of balance sheets, with all the concomitant reduction in credit availability. There are, however, more pernicious and troubling undercurrents which are slowly and inexorably sinking developed economies below the surface.
The undercurrents to which I refer are the sources of value within the economy, sources of value which have in the past ten years shifted away from the United States economy. Since 1980, there has been a 40% reduction in the number of manufacturing jobs in the United States, one symptom of intense price pressures associated with globalization. The increased cost of many commodities, including oil, leading up to the 2008 great recession, all contributed to putting economic pressures throughout the economy, from households to businesses. Strangely, oil prices did pull back after the 2007 peak, but did rebound back up to over $100 per barrel in 2011.
The normal factors which drive inflation up have not been working their magic in recent years. Wages have been stagnant and demand for goods and services has not strengthened since the recession. Outsourcing manufacturing to other countries along with intense price competition across the economy, with underutilized capacity, has resulted in a price driven recovery, instead of demand driven. Demand is just not rebounding.
On the credit side, interest rates have been extremely low, and the Fed has been injecting funds into the banking system through quantitative easing. Normally, this vast injection of liquidity into the economy would result in a lowering of the barriers to making investments, essentially a lowering of the hurdle rates for capital allocation,which presumably would increase the aggregate number of capital projects approved. If, however, there is no demand for goods and services, there is no fundamental reason for expanding capital projects. In addition to the lack of fundamental demand, banks have increased their credit requirements, and have been shoring up their own balance sheets, with increased capital reserves, reducing risk exposure, and writing down and jettisoning under performing portions of their loan portfolios. In the housing market, there has been a rebound of prices and sales of existing homes. This rebound has resulted in increased prices for housing stock but has not caused an up swell in the prices for labor and materials associated with new construction.
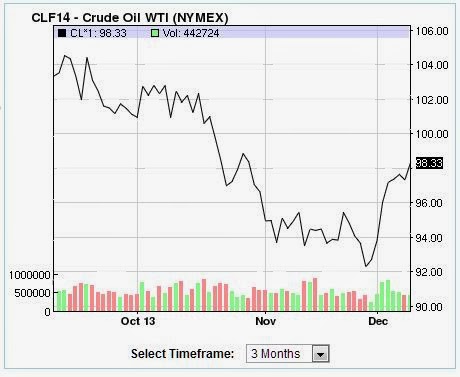
In classical terms, the definition of the cause of inflation is when too many dollars are chasing too few goods and services. This infers that the extent of the Fed's policies on lowering interest rates and providing liquidity to the banking system through the succession of quantitative easing, would normally of resulted in increased inflation. In looking at inflation in the last 40 years, there is a very high correlation between United States inflation levels and the inflation adjusted price of crude oil, as seen in the chart below.

In every period of inflation, there occurs an increase in the price of oil. Accordingly, it is an exogenous factor, oil pricing, that influences inflation. In 2013, the price of oil was above $100 per barrel for most of the year. Also in 2013, the global economy, especially in North America, Europe and emerging economies in Africa and South America have experienced lower growth rates than in 2011 and 2012. The United States is looking at a GDP growth rate for 2013 of 1.5%, significantly lower than the 2.8% in 2012. This reduced growth in the global and United States economy is putting downward pressure on oil demand and oil prices.
Because of this downward pressure on oil demand and prices, we are not likely going to see a rebound of oil prices until 2015, after oil prices have dipped below $60 per barrel and two things happen: (1) the global economy perks back up, and (2) investment in oil drilling pulls back. These two factors lead to a demand resurgence at the same time there has been a pull back in the more expensive drilling activities, which will result in a run up in oil prices. At that time, in 2015, there will be a resurgence of inflation in the United States, and not before.
Caveat - there is a good chance that oil prices will continue to buoyed by global demand factors, given that the Asian economies have lower elasticity of demand to price than European and North American economies. As such, there are likely to retain higher demand for oil in a variety of oil price regimes. This may mean that the global economy is not as whipsawed as it has been in the past with oil demand and price swings creating global economic instability, and less likely cause of a resurgence in inflation in 2015.
Another perspective on the the impact of oil prices on our economy is to look at the relationship between oil price movements and the value of the dollar. The basic premise of the analysis in this blog is that oil is an underlying factor, driving economic activity, influencing inflation and the value of the dollar. The opposite perspective would carry if oil prices were lower, there had been a pull back in oil drilling activity, and there was an up swelling in global economic activity. None of these conditions is true today, as such, we are not going to see a resurgence of inflation until 2015 at the earliest.

In 1966, Alan Greenspan, a recent Chairman of the Federal Reserve, contributed to Ayn Rand's newsletter "Objectivist", writing "In the absence of the gold standard, there is no way to protect savings from confiscation through inflation." In his 18 years at the helm of the Fed, Greenspan's policies were on the side of an inflation hawk. Equally, although in a much different time, Paul Volcker was serenely focused on monetary supply and keeping inflation in check. One of his major efforts as Chairman of the Fed was the taming of the high inflation experienced in the early 1980's, triggering a recession to cool economic activity.
Volcker has also expressed his opinion in the past few years, expressing his concerns over potentially inflationary Fed policies. In November, 2010, he spoke in Singapore about his concerns over the potential emergence of inflation associated with quantitative easing policies being led by Ben Bernanke.
In 2011, Volcker wrote an Op-Ed in the New York Times, further expanding on his concerns about reduced vigilance against inflation on the part of the Federal Reserve and the Obama administration. He also recognized, however, the "desperation" that essentially all the fiscal and monetary tools have been exausted to no great effect, other than saving the economy from going off a cliff, but not leading to even a moderately robust recovery, writing:
"There is great and understandable disappointment about high unemployment and the absence of a robust economy, and even concern about the possibility of a renewed downturn. There is also a sense of desperation that both monetary and fiscal policy have almost exhausted their potential, given the size of the fiscal deficits and the already extremely low level of interest rates."
"Rather, the danger is that if, in desperation, we turn to deliberately seeking inflation to solve real problems — our economic imbalances, sluggish productivity, and excessive leverage — we would soon find that a little inflation doesn’t work."
Our current economic circumstance in the United States is quite troubling, with millions out of work, and job creation and incomes at levels abysmally short of prior levels and what people need and expect. The Obama administration did a remarkable job addressing the great recession, keeping the global economy and financial system from collectively going over the credit cliff. As it is, we are remain reeling from the effects of severe credit correction, with a economy wide shoring up of balance sheets, with all the concomitant reduction in credit availability. There are, however, more pernicious and troubling undercurrents which are slowly and inexorably sinking developed economies below the surface.
The undercurrents to which I refer are the sources of value within the economy, sources of value which have in the past ten years shifted away from the United States economy. Since 1980, there has been a 40% reduction in the number of manufacturing jobs in the United States, one symptom of intense price pressures associated with globalization. The increased cost of many commodities, including oil, leading up to the 2008 great recession, all contributed to putting economic pressures throughout the economy, from households to businesses. Strangely, oil prices did pull back after the 2007 peak, but did rebound back up to over $100 per barrel in 2011.
The normal factors which drive inflation up have not been working their magic in recent years. Wages have been stagnant and demand for goods and services has not strengthened since the recession. Outsourcing manufacturing to other countries along with intense price competition across the economy, with underutilized capacity, has resulted in a price driven recovery, instead of demand driven. Demand is just not rebounding.
On the credit side, interest rates have been extremely low, and the Fed has been injecting funds into the banking system through quantitative easing. Normally, this vast injection of liquidity into the economy would result in a lowering of the barriers to making investments, essentially a lowering of the hurdle rates for capital allocation,which presumably would increase the aggregate number of capital projects approved. If, however, there is no demand for goods and services, there is no fundamental reason for expanding capital projects. In addition to the lack of fundamental demand, banks have increased their credit requirements, and have been shoring up their own balance sheets, with increased capital reserves, reducing risk exposure, and writing down and jettisoning under performing portions of their loan portfolios. In the housing market, there has been a rebound of prices and sales of existing homes. This rebound has resulted in increased prices for housing stock but has not caused an up swell in the prices for labor and materials associated with new construction.
In classical terms, the definition of the cause of inflation is when too many dollars are chasing too few goods and services. This infers that the extent of the Fed's policies on lowering interest rates and providing liquidity to the banking system through the succession of quantitative easing, would normally of resulted in increased inflation. In looking at inflation in the last 40 years, there is a very high correlation between United States inflation levels and the inflation adjusted price of crude oil, as seen in the chart below.

In every period of inflation, there occurs an increase in the price of oil. Accordingly, it is an exogenous factor, oil pricing, that influences inflation. In 2013, the price of oil was above $100 per barrel for most of the year. Also in 2013, the global economy, especially in North America, Europe and emerging economies in Africa and South America have experienced lower growth rates than in 2011 and 2012. The United States is looking at a GDP growth rate for 2013 of 1.5%, significantly lower than the 2.8% in 2012. This reduced growth in the global and United States economy is putting downward pressure on oil demand and oil prices.
Because of this downward pressure on oil demand and prices, we are not likely going to see a rebound of oil prices until 2015, after oil prices have dipped below $60 per barrel and two things happen: (1) the global economy perks back up, and (2) investment in oil drilling pulls back. These two factors lead to a demand resurgence at the same time there has been a pull back in the more expensive drilling activities, which will result in a run up in oil prices. At that time, in 2015, there will be a resurgence of inflation in the United States, and not before.
Caveat - there is a good chance that oil prices will continue to buoyed by global demand factors, given that the Asian economies have lower elasticity of demand to price than European and North American economies. As such, there are likely to retain higher demand for oil in a variety of oil price regimes. This may mean that the global economy is not as whipsawed as it has been in the past with oil demand and price swings creating global economic instability, and less likely cause of a resurgence in inflation in 2015.
Another perspective on the the impact of oil prices on our economy is to look at the relationship between oil price movements and the value of the dollar. The basic premise of the analysis in this blog is that oil is an underlying factor, driving economic activity, influencing inflation and the value of the dollar. The opposite perspective would carry if oil prices were lower, there had been a pull back in oil drilling activity, and there was an up swelling in global economic activity. None of these conditions is true today, as such, we are not going to see a resurgence of inflation until 2015 at the earliest.

Saturday, October 26, 2013
Predicting Employment - US Employment Will Not Achieve Pre-Recession Levels Until 2018
98% of annual employment in the United States in the past 30 years is explained by two factors: total US primary energy use in Btu's and crude oil prices in 2011 dollars per barrel. To predict US employment going forward is simply a matter of forecasting total energy use and inflation adjusted petroleum prices. I say simply almost as tongue in cheek, given uncertainties associated with predicting petroleum prices and energy consumption. This approach does, however, begin to bracket the question.
The initial premise was to take a look at the correlation of aggregate energy consumption and employment. The following chart shows that there is an amazing correlation between employment and energy use in the United States. The energy consumption is based on primary energy use int he United States, expressed in quadrillion Btu's, including all forms of energy. Certain observations can be drawn from the chart. Over the period from around 1955 through 1971, energy use in the United States grew quite rapidly, and grew faster than employment. The impact of the Arab oil embargo can be observed with a downdraft in aggregate energy, followed by another rise and steep drop in 1979. Both of these drops in demand were a result of steep rises in oil prices.
 Since 1981, the movements of energy use and employment moved much more in lockstep, with an almost uncanny correlation in the period of 2007 through 2011.
Another observation that appears uncanny is that both energy and employment tripled in the period from 1949 through 2011. Energy use rose from 32 quads in 1949 to 97 quads in 2011. Employment rose from 44 million in 1949 to 131 million in 2011.
The most troubling observation about this data is that our energy use as a nation appears to have stopped moving upward, hitting a peak of 101.3 quadrillion Btu's in 2007, with 2013 primary energy use around 97 quads, or 4% below the 2007 peak. At a very basic level, we may not achieve pre-recession employment levels until such time that energy use has moved up by 5%. Indeed, the trajectory of growth in primary energy consumption has stagnated since 2000, with current energy use of around 97 quads below the 2000 level of 98.8 quads. As such, the inference is that we may have hit a new period in the US economy, with low growth in energy consumption, with a corresponding period of low growth in employment.
To further my understanding of the relationship between energy and employment, I performed a regression analysis of US employment from 1982 through 2011 expressed in millions, against primary energy consumption in quadrillion Btu's, and inflation adjusted crude oil prices expressed in constant 2011 dollars per barrel. I arrived at an equation which explains 98% of employment levels in the United States. I applied the equation first to historical energy use and oil price data, to see how it fit with actual employment levels in the past 30 years. I then applied the equation to develop a forecast of employment, based on EIA's forecast primary energy use, and fixing crude oil prices at $96 per barrel in 2011 dollars. The results of these analyses can be seen in the chart below.
 Based on EIA's forecast of primary energy use, the regression analysis tells us that employment levels in the United States will not achieve pre-recession levels until 2018.
The data also tells us that employment is going to grow by 0.4% per year over the next 20 years. Unless something changes drastically, this means that the people of the United States will be suffering extended underemployment for decades to come.
The initial premise was to take a look at the correlation of aggregate energy consumption and employment. The following chart shows that there is an amazing correlation between employment and energy use in the United States. The energy consumption is based on primary energy use int he United States, expressed in quadrillion Btu's, including all forms of energy. Certain observations can be drawn from the chart. Over the period from around 1955 through 1971, energy use in the United States grew quite rapidly, and grew faster than employment. The impact of the Arab oil embargo can be observed with a downdraft in aggregate energy, followed by another rise and steep drop in 1979. Both of these drops in demand were a result of steep rises in oil prices.
 Since 1981, the movements of energy use and employment moved much more in lockstep, with an almost uncanny correlation in the period of 2007 through 2011.
 Another observation that appears uncanny is that both energy and employment tripled in the period from 1949 through 2011. Energy use rose from 32 quads in 1949 to 97 quads in 2011. Employment rose from 44 million in 1949 to 131 million in 2011.
The most troubling observation about this data is that our energy use as a nation appears to have stopped moving upward, hitting a peak of 101.3 quadrillion Btu's in 2007, with 2013 primary energy use around 97 quads, or 4% below the 2007 peak. At a very basic level, we may not achieve pre-recession employment levels until such time that energy use has moved up by 5%. Indeed, the trajectory of growth in primary energy consumption has stagnated since 2000, with current energy use of around 97 quads below the 2000 level of 98.8 quads. As such, the inference is that we may have hit a new period in the US economy, with low growth in energy consumption, with a corresponding period of low growth in employment.
To further my understanding of the relationship between energy and employment, I performed a regression analysis of US employment from 1982 through 2011 expressed in millions, against primary energy consumption in quadrillion Btu's, and inflation adjusted crude oil prices expressed in constant 2011 dollars per barrel. I arrived at an equation which explains 98% of employment levels in the United States. I applied the equation first to historical energy use and oil price data, to see how it fit with actual employment levels in the past 30 years. I then applied the equation to develop a forecast of employment, based on EIA's forecast primary energy use, and fixing crude oil prices at $96 per barrel in 2011 dollars. The results of these analyses can be seen in the chart below.

The data also tells us that employment is going to grow by 0.4% per year over the next 20 years. Unless something changes drastically, this means that the people of the United States will be suffering extended underemployment for decades to come.
Wednesday, October 23, 2013
Carbon Tax: A Few Thoughts on Implications for Economic Growth and Clean Energy Investment Policies
(Written in response to article on thebreakthrough.org site: "Should We Swap Energy Subsidies for a Carbon Tax?")
A carbon tax will impact the economy, with the directionality and extent conditional upon alternatives available to energy consumers, and the allocation of carbon tax receipts by the government. In addition, increased taxation reduces the velocity of money in the economy, which reduces economic activity.
The impact of a carbon tax on energy consumers depends on available alternatives and opportunities for switching. In the short term, a carbon tax would have a negative effect on the economy, diverting financial resources away from household budgets, reducing discretionary spending, and reducing profits for businesses. The effect of a tax on gasoline for consumers, for example, results in reduced driving, or reducing other expenditures. Wealthy consumers can offset increased gasoline costs by purchasing a hybrid car, overcoming the increase in gasoline taxes.
Over time, leveraging market forces to identify and source lower carbon alternatives can be the most effective means to obtain the greatest return on deployed capital and resources. If there are no lower cost forms of energy available, or capital for improving efficiency is limited, then the overall effect of a carbon tax will be reduced economic activity.
A carbon tax is regressive, as economically disadvantaged people do not have the capital and resources to acquire lower cost alternatives, resulting in their otherwise being stuck with a higher cost life. This points to the need for the government to dampen the negative impacts of the carbon tax.
The choice of what the government does with carbon tax receipts is critical, informed by the potential economic pratfalls associated with instituting the carbon tax. Overcoming the dampening effect of a carbon tax is accomplished by making lower cost energy resources available as well as loosening up capital resources to accelerate investments in improving energy efficiency and productivity. A 5% carbon tax, for example, can be overcome by a 7% improvement in energy efficiency, for example, with the added 2% to cover capital costs.
A 5% carbon tax may encourage certain switching behaviors, but as an incentive, is not sufficient to encourage investment in alternative energy technologies that have larger price/performance gaps. For example, there was a time when wind turbines were three times more expansive than what is needed to compete on the grid. A 5% carbon tax would really not be enough to encourage investment to bridge a 200% price/performance. Hence, there is a reason for governments to participate implement policies targeting closing the price/performance gap on emerging clean energy technologies. Wind and solar technologies, for example, have both benefited from favorable financial policies on the part of governments. As such, in certain markets around the world, both wind and solar power technologies are achieving grid parity economies. These cost reductions have been achieved by the government priming market demand, resulting in scale economies and continuous movement down the learning curve.
In summary, it is not a question of swapping energy subsidies for a carbon tax. It is recommended to have both policies, with receipts from a carbon tax providing energy subsidies to encourage lower cost alternatives, encouragement of investments in energy efficiency and productivity, as well as addressing regressive nature of the tax.
Monday, October 21, 2013
Dollar Will Continue to Strengthen With Softening Global Economy and Continued Weak Demand for Oil
As seen in the accompanying chart, the recent decline in oil prices correlates well with recent surge in the value of the dollar. The trade weighted dollar index hit a low of 94 in July 2011, and has recently surged to a high of 103 in September 2013, an increase in value of 9.6%. Over that same period of time, Brent crude spot oil prices hit a peak of $126 per barrel in April, 2012, and have since fallen to a low of $100 in October, 2013, representing a 20.6% decline in cost. On initial observation, the current directional trend appears to be a continuing strengthening of the dollar and a continued decline in oil prices.
Factors resulting in a general tempering of the global demand for oil exogenous to the US economy include recent tempering of the Chinese economy, a cool down of India's economy, and a general sluggishness across the globe of what were previously economies exhibiting higher growth rates.
According to the Bureau of Economic Analysis, the US economy grew by 2.8% in 2012. The Conference Board forecasts a rather tepid growth of 1.5% in the US economy in 2013. This level of growth is corroborated by a third quarter 2013 survey of 41 forecasters by the Federal Reserve Bank of Philadelphia, with a consensus forecast of 1.5% GDP growth for 2013.
The International Monetary Fund recently reduced its forecast for global growth in 2013 and 2014, pointing out that "Emerging market and developing economy growth rates are now down some three percentage points from 2010 levels, with Brazil, China and India accounting for two thirds of the decline."
These declines in global economic growth rates contribute to a reduced expectation for oil market pressures, and a corresponding reduction in oil prices. It may just be that these reductions in market pressures for oil are an important contributing factor in the recent run-up in the value of the dollar. With a continued expected sluggishness if not softening of the global economy, we are likely to see continued reduction in oil prices and an increase in the value of the dollar.

Monday, October 14, 2013
China Surpasses the United States as the World's Largest Oil Importer
According to EIA's monthly Short Term Energy and Winter Fuels Outlook, China surpassed the United States in September, 2013 as the world's largest importer of petroleum.


Tuesday, October 1, 2013
Worldwide Installed Capacity of Wind Power To Blow Past Nuclear
Frequently, nuclear is held out as a carbon-free scalable technology, which it definitely is. It may seem to some, however, that there is an implied differentiation that frequently accompanies these statements, implying that technologies such as wind and solar are not scalable, and hence less feasible when compared to nuclear. Without getting into the details, I would like to share the following chart, which shows the global installed capacity of nuclear power and wind power.
What the chart shows, empirically, is that whether or not wind is scalable compared to nuclear, it will surpass nuclear as a major global power source, perhaps as soon as within the next two years. Perhaps this implies that wind is a scalable power technology, although what is likely meant by scalable is very large central plants. Being a distributed or diffuse power source does not seem to stand in the way of unprecedented growth of windpower.

What the chart shows, empirically, is that whether or not wind is scalable compared to nuclear, it will surpass nuclear as a major global power source, perhaps as soon as within the next two years. Perhaps this implies that wind is a scalable power technology, although what is likely meant by scalable is very large central plants. Being a distributed or diffuse power source does not seem to stand in the way of unprecedented growth of windpower.
Sunday, June 30, 2013
Leveraged Growth Strategies
Are You Achieving Your Growth Targets?
Setting growth targets is easy - achieving growth targets is difficult. Why aren't you hitting your growth targets? Many companies are challenged in achieving their growth targets, whether emerging enterprises or established businesses. Customer preferences shift, new technologies are introduced, regulations change. Competitors lower productions costs or increase performance and functionality, and new entrants introduce disruptive business models. For emerging enterprises, and established companies introducing new business units or products, the challenges of deciding what to offer, which customers to target, and how to successfully position against the competition is daunting.
A Leveraged Growth Strategy reduces uncertainty and creates organizational focus for developing and implementing successful growth strategies.
Have You Identified Your Most Important Unanswered Questions?
Developing a leveraged growth strategy begins with sweeping out the corners with your team and stakeholders, making sure that you have the right questions in front of your before you start looking for answers. The approach that is best to determine your critical questions is conducting an issues analysis. An illustrative issues analysis is provided below.

Issues analysis begins with brainstorming unanswered questions. Each member of a team independently writes down unanswered questions on sticky notes, and the sticky notes are placed up on a wall. The individual sticky notes are organized dynamically in two ways. First, they are grouped into like questions. Market questions are grouped together, finance questions are grouped together, operations questions are grouped together, etc.
Then the stickies are placed in hierarchies, with the higher order and broader questions grouped near the top, and subsidiary questions placed lower on the wall. Overlapping or duplicitous questions are removed, and remaining questions are consolidated.
Issues analysis consists of yes or no questions, with the requirement that all questions in the hierarchy have to be answered in the affirmative, starting at the lowest level and moving up. Only when all questions are answered in the affirmative will the single highest order question be answered in the affirmative.
The reason for preparing the issues analysis is to identify the key questions that have to be answered before you can have a growth strategy. It creates focus on critical questions and can be used as a check list for developing your organization's growth strategy.
Does Your Team Have Shared Ambitions and Objectives?
To successfully implement any strategy at the back-end requires buy-in and commitment to the objectives and process at the beginning. This is the strongest argument for frequent communication, and, more importantly, broad participation.
Ambition driven strategy is distinct and different from incremental strategy. Where does your organization want to be in five years? What is your specific vision for your organization? Begin with a draft vision, and work it really hard with your leadership team to determine the specific picture of where you want to be in five years. The vision is defined by very specific metrics, such as the number of customers, the mix of customers, revenues, number of products and services offered, the scale of the organization in terms of employee count, scale and type of plant and equipment, and operating earnings and profits.
Once the five year vision of your organization is well defined and agreed to by the leadership team, you can then connect the dots, assessing how far your existing products and services will get you to your five year target. The gap in your revenues forms the basis and reason for putting in place a leveraged growth strategy.
Do You Have A Process to Prioritize Growth Opportunities?
This next phase is the core of developing a leveraged growth strategy. Prior to getting deep into brainstorming and characterizing specific growth opportunities, the first step is to define your opportunity evaluation criteria, considering both fit criteria and attractiveness criteria.
Attractiveness criteria is focused on the market-facing opportunity, separate from your company. It is looking at markets as anyone would look at markets. Criteria is used for comparing market opportunities, in order to rank order your specific market opportunities. The objective is to identify four to six specific opportunity attractiveness criteria. Illustrative criteria include market size, market growth rate, profitability, competitive intensity, ability to reach, etc.
Fit criteria is absolutely necessary for developing a leveraged growth strategy. The fit criteria is focused on criteria specific to your organization's leverageable assets, competencies and capabilities, and your goals and objectives. Setting fit criteria is what distinguished this process from other strategy development processes.
The challenges of entering new markets are quite severe, and require entering with all of the competitive advantages as possible. This includes entering markets with which you bring specific skills and competencies along with you. If you enter a market, and establish a new business opportunity that is too far off your core competencies, your likelihood for success is extremely low, no matter how attractive the market opportunity might be.
During the nineteen-nineties, utility companies, faced with deregulation, began entering competitive markets, including cable television. Cable television was originally considered very similar to the utilities' core businesses, namely pipes and wires. At the end of the day, however, the cable business has a huge customer service component, with frequent changes to service offerings and very frequent customer contacts. This level of customer interactions was completely different business model than the regulated utility business, and utilities exited the business.
Setting the fit criteria begins with listing you strengths, unique competencies and capabilities. Illustrative fit criteria includes leveraging strengths, achieves growth objectives, provides opportunity for sustainable competitive advantage, achievable within certain capital and cash flow boundaries, etc.

The screening process begins with conducting an open brainstorming process with your team. No idea is to be discounted at the outset. It is important for each opportunity to be sufficiently defined and characterized, so that all members of the team understand what the opportunity is. Each opportunity needs a name and a brief characterization.
The first screening is a very high level screening to assess the broad test for sanity and the alignment with the company's overall strategy. This screening may reduce the number of opportunities by one-quarter to one-third, for example. It is really just a reasonableness screen.
Once the initial screening is complete, the remaining opportunities need to be characterized, in short order and on a preliminary basis, with respect to the fit and attractiveness criteria. This can usually be done in a table format, in a matrix of the opportunities matrixed against the fit and attractiveness criteria. The task can be assigned to multiple team members in order to spread the work requirements and facilitate the process of filling out each spare in the matrix.
The next step is the assignment of numerical scoring values for each opportunity by each fit and attractiveness criteria. The purpose for scoring is to distinguish between opportunities. Absolute precision is not needed nor called for at this stage. The scoring shall use numbers between the values of one and five, with five representing the highest value, indicating the highest relative fit or the highest relative attractiveness.
In addition to the scoring system, each of the criteria can have overall weighting. This is not always necessary, and is usually called for when criteria are significantly more or less pertinent or valuable when compared to other criteria. One way to weight specific criteria is to simply apply a numerical value associated with each criteria, between the value of 0.8 for a low weighting, and 1.2 for a high weighting.
Once the scoring criteria have been applied for each opportunity, the average score can be determined for each opportunity, one average number for the fit criteria for each opportunity, and one average number for the attractiveness criteria for each opportunity.
Can You Identify Your Highest Priority Growth Initiatives?
Charting your growth opportunities on an attractiveness-fit chart helps understand your highest priority growth opportunities. Typically, the opportunities in the top right quadrant, those with the highest fit and the highest attractiveness, are those you want to focus on. In addition, those that are attractive from a market perspective, yet may not have the highest fit, can also be part of your growth strategy, as those with slightly lower fit scores can move up on fit, as long as you commit to making certain investments in those opportunities. For example, if a specific business opportunity requires a call center, and you have no call centers or call center experience, you have the opportunity to acquire a call center business, which would increase the fit of the business opportunity substantially.

At this stage in the process, you and your team can select those opportunities you want to develop a cohesive and compelling strategy and business case.
Can You Make Cohesive and Compelling Business Case?
With a refined set of selected opportunities, you can integrate the opportunities into a single business strategy for growth. Preparing the strategy requires developing business plan summaries for each initiative, including financial projections. The business case for your growth strategy needs to include an assessment of the market, the products and services offered, customers and market segments targeted, the sales process and plan, the source of competitive advantage and differentiation, the channel and partnering strategy, the infrastructure, business processes and plant a equipment that is required, a staffing plan, a risk analysis and mitigation plan, competitive analysis, a financial plan, and a milestone and performance metrics schedule.

Can You Operationalize the Business?
The final stage is implementation. Once approvals are in place to go forward, a detailed action plan helps keep the implementation plan on time. All the details associated with putting a business in place have to be understood in advance, with key roles and responsibilities assigned for implementation, including timelines and due dates.

Post Script - If you want a PDF copy of my Leveraged Growth post, send me an email request to brad(at)velerity.com, and I would be pleased to send you a copy.
Setting growth targets is easy - achieving growth targets is difficult. Why aren't you hitting your growth targets? Many companies are challenged in achieving their growth targets, whether emerging enterprises or established businesses. Customer preferences shift, new technologies are introduced, regulations change. Competitors lower productions costs or increase performance and functionality, and new entrants introduce disruptive business models. For emerging enterprises, and established companies introducing new business units or products, the challenges of deciding what to offer, which customers to target, and how to successfully position against the competition is daunting.
A Leveraged Growth Strategy reduces uncertainty and creates organizational focus for developing and implementing successful growth strategies.
Have You Identified Your Most Important Unanswered Questions?
Developing a leveraged growth strategy begins with sweeping out the corners with your team and stakeholders, making sure that you have the right questions in front of your before you start looking for answers. The approach that is best to determine your critical questions is conducting an issues analysis. An illustrative issues analysis is provided below.
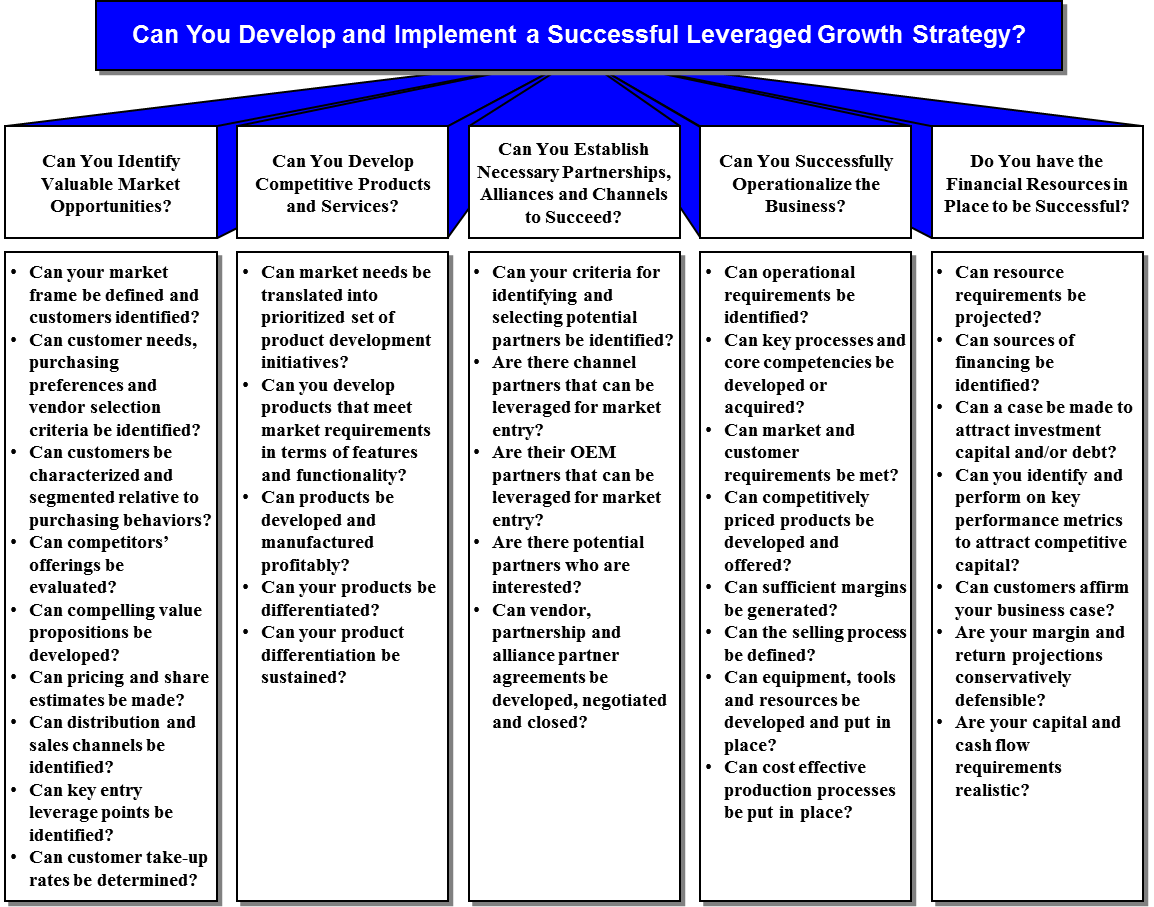
Issues analysis begins with brainstorming unanswered questions. Each member of a team independently writes down unanswered questions on sticky notes, and the sticky notes are placed up on a wall. The individual sticky notes are organized dynamically in two ways. First, they are grouped into like questions. Market questions are grouped together, finance questions are grouped together, operations questions are grouped together, etc.
Then the stickies are placed in hierarchies, with the higher order and broader questions grouped near the top, and subsidiary questions placed lower on the wall. Overlapping or duplicitous questions are removed, and remaining questions are consolidated.
Issues analysis consists of yes or no questions, with the requirement that all questions in the hierarchy have to be answered in the affirmative, starting at the lowest level and moving up. Only when all questions are answered in the affirmative will the single highest order question be answered in the affirmative.
The reason for preparing the issues analysis is to identify the key questions that have to be answered before you can have a growth strategy. It creates focus on critical questions and can be used as a check list for developing your organization's growth strategy.
Does Your Team Have Shared Ambitions and Objectives?
To successfully implement any strategy at the back-end requires buy-in and commitment to the objectives and process at the beginning. This is the strongest argument for frequent communication, and, more importantly, broad participation.
Ambition driven strategy is distinct and different from incremental strategy. Where does your organization want to be in five years? What is your specific vision for your organization? Begin with a draft vision, and work it really hard with your leadership team to determine the specific picture of where you want to be in five years. The vision is defined by very specific metrics, such as the number of customers, the mix of customers, revenues, number of products and services offered, the scale of the organization in terms of employee count, scale and type of plant and equipment, and operating earnings and profits.
Once the five year vision of your organization is well defined and agreed to by the leadership team, you can then connect the dots, assessing how far your existing products and services will get you to your five year target. The gap in your revenues forms the basis and reason for putting in place a leveraged growth strategy.
Do You Have A Process to Prioritize Growth Opportunities?
This next phase is the core of developing a leveraged growth strategy. Prior to getting deep into brainstorming and characterizing specific growth opportunities, the first step is to define your opportunity evaluation criteria, considering both fit criteria and attractiveness criteria.
Attractiveness criteria is focused on the market-facing opportunity, separate from your company. It is looking at markets as anyone would look at markets. Criteria is used for comparing market opportunities, in order to rank order your specific market opportunities. The objective is to identify four to six specific opportunity attractiveness criteria. Illustrative criteria include market size, market growth rate, profitability, competitive intensity, ability to reach, etc.
Fit criteria is absolutely necessary for developing a leveraged growth strategy. The fit criteria is focused on criteria specific to your organization's leverageable assets, competencies and capabilities, and your goals and objectives. Setting fit criteria is what distinguished this process from other strategy development processes.
The challenges of entering new markets are quite severe, and require entering with all of the competitive advantages as possible. This includes entering markets with which you bring specific skills and competencies along with you. If you enter a market, and establish a new business opportunity that is too far off your core competencies, your likelihood for success is extremely low, no matter how attractive the market opportunity might be.
During the nineteen-nineties, utility companies, faced with deregulation, began entering competitive markets, including cable television. Cable television was originally considered very similar to the utilities' core businesses, namely pipes and wires. At the end of the day, however, the cable business has a huge customer service component, with frequent changes to service offerings and very frequent customer contacts. This level of customer interactions was completely different business model than the regulated utility business, and utilities exited the business.
Setting the fit criteria begins with listing you strengths, unique competencies and capabilities. Illustrative fit criteria includes leveraging strengths, achieves growth objectives, provides opportunity for sustainable competitive advantage, achievable within certain capital and cash flow boundaries, etc.
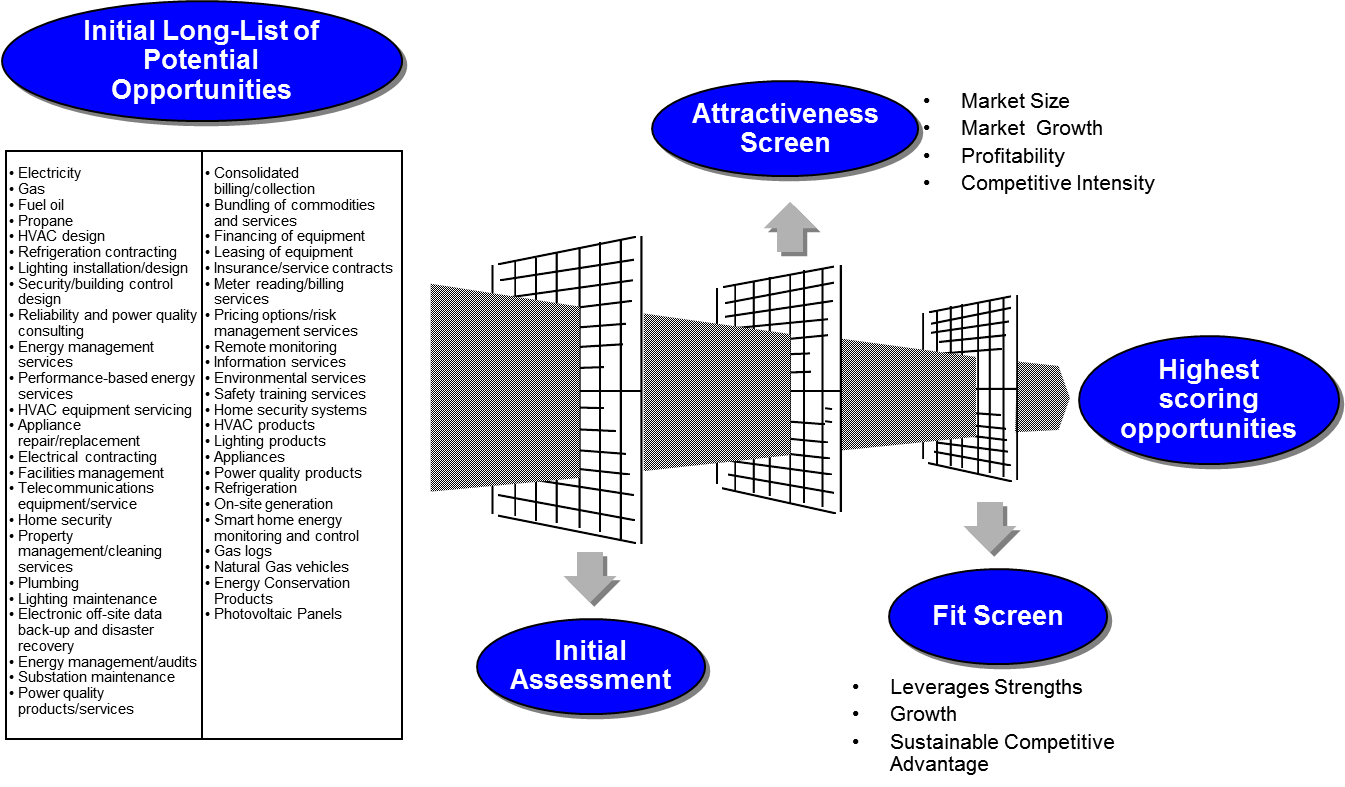
The screening process begins with conducting an open brainstorming process with your team. No idea is to be discounted at the outset. It is important for each opportunity to be sufficiently defined and characterized, so that all members of the team understand what the opportunity is. Each opportunity needs a name and a brief characterization.
The first screening is a very high level screening to assess the broad test for sanity and the alignment with the company's overall strategy. This screening may reduce the number of opportunities by one-quarter to one-third, for example. It is really just a reasonableness screen.
Once the initial screening is complete, the remaining opportunities need to be characterized, in short order and on a preliminary basis, with respect to the fit and attractiveness criteria. This can usually be done in a table format, in a matrix of the opportunities matrixed against the fit and attractiveness criteria. The task can be assigned to multiple team members in order to spread the work requirements and facilitate the process of filling out each spare in the matrix.
The next step is the assignment of numerical scoring values for each opportunity by each fit and attractiveness criteria. The purpose for scoring is to distinguish between opportunities. Absolute precision is not needed nor called for at this stage. The scoring shall use numbers between the values of one and five, with five representing the highest value, indicating the highest relative fit or the highest relative attractiveness.
In addition to the scoring system, each of the criteria can have overall weighting. This is not always necessary, and is usually called for when criteria are significantly more or less pertinent or valuable when compared to other criteria. One way to weight specific criteria is to simply apply a numerical value associated with each criteria, between the value of 0.8 for a low weighting, and 1.2 for a high weighting.
Once the scoring criteria have been applied for each opportunity, the average score can be determined for each opportunity, one average number for the fit criteria for each opportunity, and one average number for the attractiveness criteria for each opportunity.
Can You Identify Your Highest Priority Growth Initiatives?
Charting your growth opportunities on an attractiveness-fit chart helps understand your highest priority growth opportunities. Typically, the opportunities in the top right quadrant, those with the highest fit and the highest attractiveness, are those you want to focus on. In addition, those that are attractive from a market perspective, yet may not have the highest fit, can also be part of your growth strategy, as those with slightly lower fit scores can move up on fit, as long as you commit to making certain investments in those opportunities. For example, if a specific business opportunity requires a call center, and you have no call centers or call center experience, you have the opportunity to acquire a call center business, which would increase the fit of the business opportunity substantially.
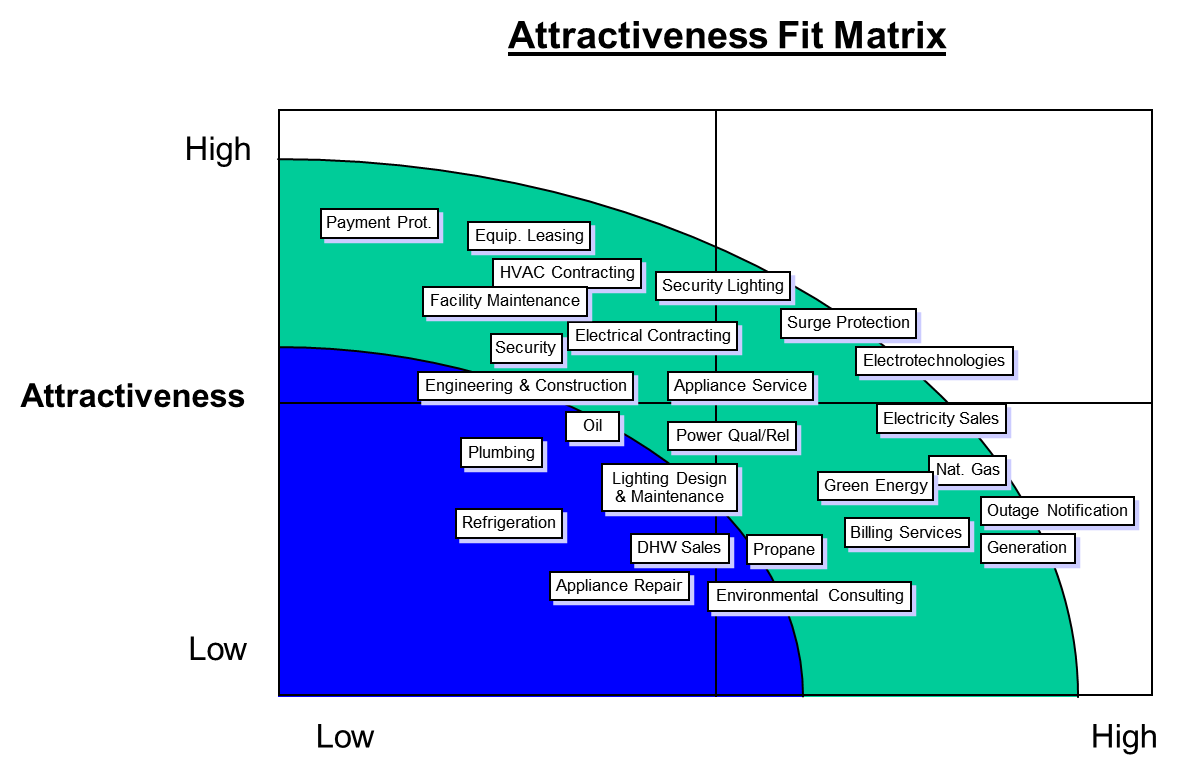
At this stage in the process, you and your team can select those opportunities you want to develop a cohesive and compelling strategy and business case.
Can You Make Cohesive and Compelling Business Case?
With a refined set of selected opportunities, you can integrate the opportunities into a single business strategy for growth. Preparing the strategy requires developing business plan summaries for each initiative, including financial projections. The business case for your growth strategy needs to include an assessment of the market, the products and services offered, customers and market segments targeted, the sales process and plan, the source of competitive advantage and differentiation, the channel and partnering strategy, the infrastructure, business processes and plant a equipment that is required, a staffing plan, a risk analysis and mitigation plan, competitive analysis, a financial plan, and a milestone and performance metrics schedule.
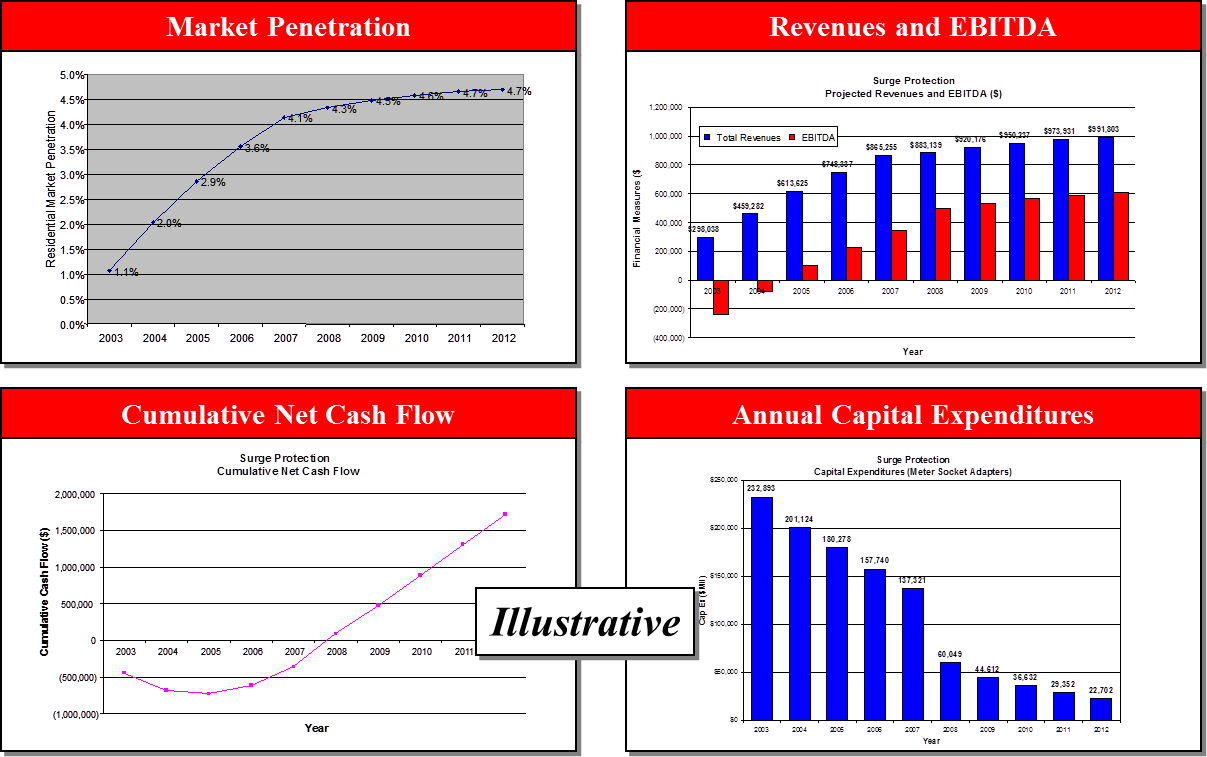
Can You Operationalize the Business?
The final stage is implementation. Once approvals are in place to go forward, a detailed action plan helps keep the implementation plan on time. All the details associated with putting a business in place have to be understood in advance, with key roles and responsibilities assigned for implementation, including timelines and due dates.
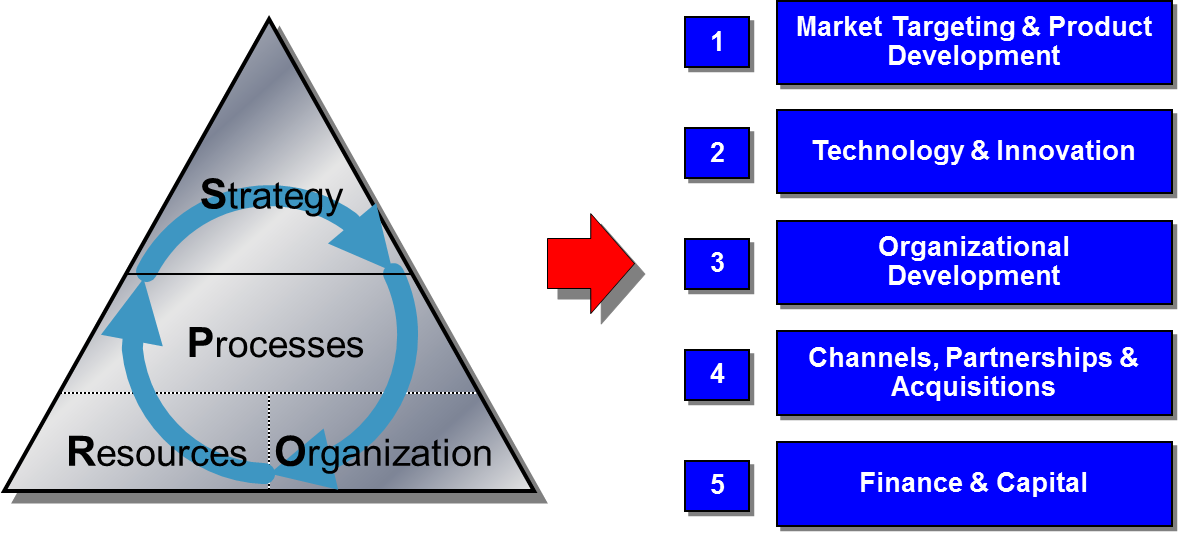
Post Script - If you want a PDF copy of my Leveraged Growth post, send me an email request to brad(at)velerity.com, and I would be pleased to send you a copy.
Tuesday, April 16, 2013
Oil Prices Drop 10% in 2 Weeks, Saving the US $71 Billion Per Year
Oil prices joined gold and other commodities in a full court market swoon, dropping from a high of $98 per barrel two weeks ago, for West Texas Intermediate, to close yesterday at close to $88 per barrel, a 10.2% drop. With United States oil consumption at 19.6 million barrels per day, this means a savings to our economy of $71.5 billion per year. Historically, oil prices at the high level that we have seen these past few years have caused recessions in the United States. The savings to our economy associated with this recent market drop for oil is a benefit to our economy.
The reason for the downswing in commodities is the galloping sense that the world economy may not be growing as expected, with the specific news Monday morning that China's growth in the first quarter this year was 7.7%, which is below the 7.9% of the last quarter of 2012, and below expectations that it would be closer to 8% in the first quarter of this year.
As a consequence, silver dropped as much as much as 11.5% in markets on Monday, and gold dropped 6.6% on Monday. As mentioned, oil has dropped 10.5% in the past two weeks. Below is the chart of WTI crude oil prices from October, 2012 through yesterday, April 15, 2013. Click on image below for larger view of the graph.
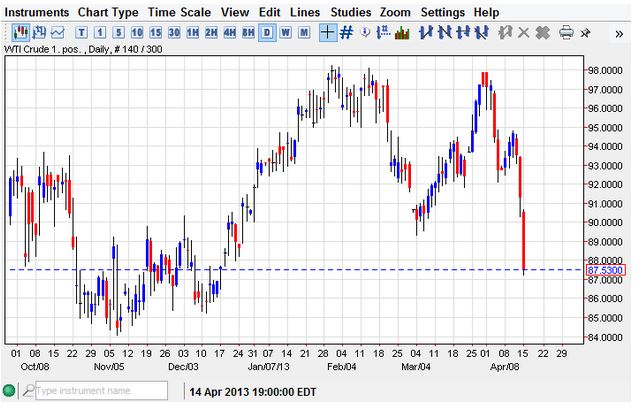
Saturday, April 13, 2013
Tidal Power Investment Surging - Commercialization On The Horizon
Tidal energy represents a significant power source, with one estimate of the addressable market being upwards of 3 TeraWatts, according to the IEA. This corresponds to 60% of the world's currently installed electricity generating capacity of 5.066 TeraWatts. The level of investment in advanced tidal energy technologies has increased significantly in the past decade, with scale deployments of new technologies currently underway. There are three major types of tidal power, each with different market sizes, technologies and levels of maturity.
Tidal Barrages
Tidal barrages are the most mature tidal technology, with three major installations around the world with more in the planning stage. These include the oldest installation, the 240 MW installation in Rance, France; the 17.8 MW Annapolis Royal Generating Station in Annapolis Royal, Canada; and the recently opened 254 MW Sihwa Lake Tidal Power Plant in South Korea.
 The Rance tidal barrage, also known as La Rance Power Station, is located in Brittany, France. The 240 MW installation was completed in 1967 and has several unique features. It serves as a causeway across the Rance estuary, significantly shortening the drive time along the French coast, between Dinard and St. Malo. In order to preserve boat access to the inland side of the barrage, a lock system was installed, along with a swing bridge for the roadway. The plant has 24 turbines, and produces approximately 600 GWh per year. Although the original cost to construct the facility was high, it has since been paid for, and the current marginal cost is less than that of nuclear power. The tidal flow in that section of France is approximately 8 meters, which is helpful for tidal power production. .
 The 17.8 MW Annapolis Royal Generating Station is located at the mouth of the Annapolis River on the Bay of Fundy, Nova Scotia, Canada. It was built over a four year period, and commissioned in 1984. There are some unique features associated with the facility. First off, it produces power only on the outgoing tide, allowing the head water basin to fill on the incoming tide, and then producing power over a five hour period on the outgoing tide. This cycle is repeated roughly twice per day, and produces approximately 80-100 MWhrs per day, depending on the ties. The tides in the Bay of Fundy average 12 meters, and can be as high as 16 meters. At the location of the Annapolis station average 7.5 meters, and can rise as high as 12 meters.

The Annapolis station uses a single-effect turbine, meaning that it generates power flowing in only one direction. The La Rance station, on the other hand, utilizes a double effect turbine, allowing for the extraction of power on both the incoming and outgoing tides. It has been best determined that double effect turbines require a higher head than single effect turbines. For the Annapolis station, it generates power upon conditions where there is at least a 1.6 meter differential between the head pond and sea level. The Annapolis turbine is quite large, with a 3 meter diameter.
Tidal Current
Tidal current systems are either horizontal axis two and three bladed turbines or vertical axis type turbine designs, known as axial turbines, positioned horizontally. Tidal current systems are typically secured to or positioned on the sea floor in arrays. These systems are just now emerging, with two designs having completed scale deployments and are taking commercial orders. The two most mature designs include the 1.2 MW SeaGen system in Strangford Lough in Northern Ireland; and the 180 kW TidGen deployment in Cobscook Bay, near Eastport, Maine.
The 1.2 MW SeaGen system in Strangford Lough in Northern Ireland was deployed in 2008, and has been in operation and under extensive testing since that time. The design is a monopole support, anchored to the sea floor, with a horizontal strut that supports two horizontal axis rotors at opposite ends. The rotors themselves have the highest weep area of any deployed system, of 402 square meters for the pair of rotors. Each rotor is 16 meters in diameter and spins at 14 rpm.
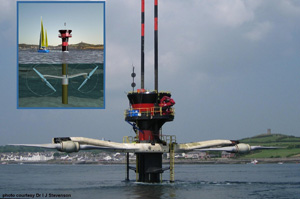
The system cost $18.36 million. The cross beam is designed to be raised and lowered to facilitate maintenance. The system is at the mouth of the Strangford Lough, or Loch, Southwest of Belfast, which encompasses 105 square kilometers of water, one of the largest coastal bays. The system produces up to 6,000 MWhrs per year, according to the company’s web site, corresponding to a 57% capacity factor, which is much higher than wind or solar.
The pitch of the blades can be adjusted up to 180 degrees, allowing for bidirectional flow and energy capture. Additionally, the blades are purposefully located in the top third of the water column, where the greatest water flow is found.
The company which manufactured the system is taking its experience and developing a 2 MW system for commercial deployment, with 20 meter diameter blades in a similar configuration. They are also planning a 3 MW system that is deployed in deeper waters, where the surface is not pierced by the system. The 3 MW design is in the very early stages of design at this time.

Tidal Lagoons
Tidal lagoons are large shallow areas defined by perimeter barriers, with a sluice way with turbines to generate power. There are no tidal lagoons currently built, although there are two major designs on the drawing board. One is the proposed 250 MW Swansea tidal lagoon in Swansea, UK. The other is the 300 MW near the mouth of the Yalu River in China. Tidal lagoons are expensive to build, but have higher capacity factors, of about 62%.
The proposed 250 MW Swansea tidal lagoon is an ambitious project proposed in Swansea England. The system relies on approximately 7 miles of barrages to be built, to create the lagoon. The expected cost of the project is $841 million. The system is designed to generate power on both the incoming and outgoing tides, estimated to operate for 16 hours per day.
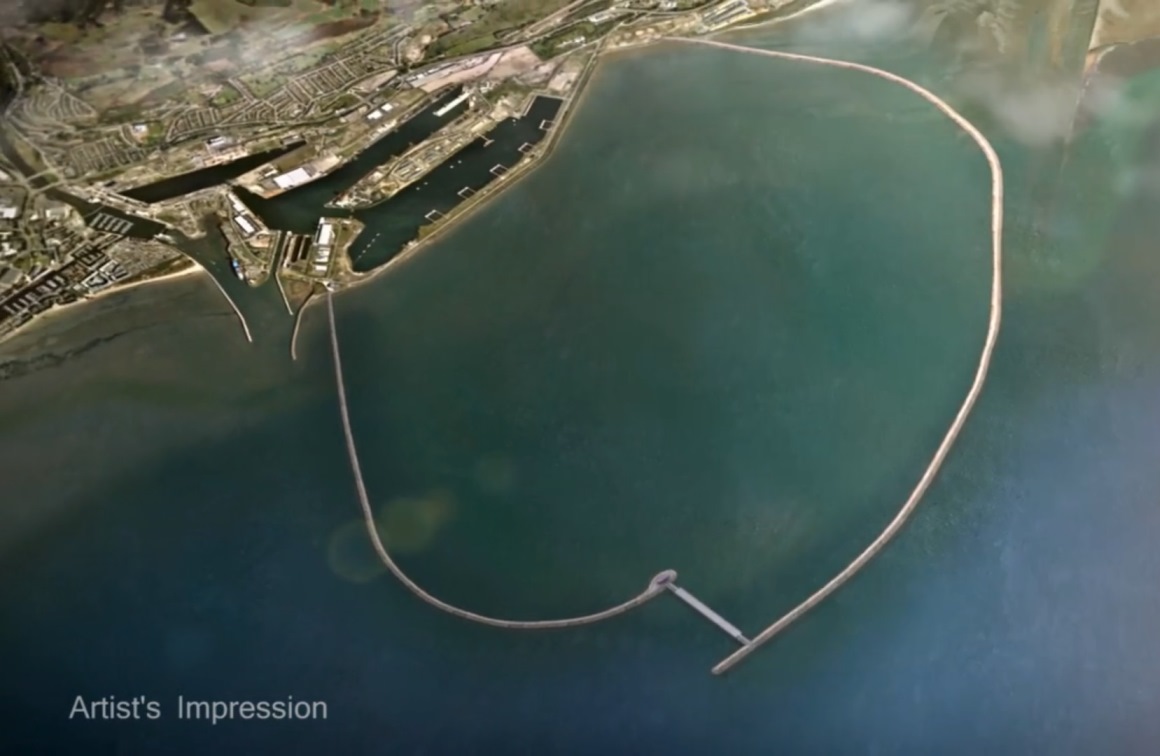
Friday, April 12, 2013
US New Electric Generating Capacity Brought Online in March, 2013 is 100% Solar!
According to FERC's Office of Energy Projects, 100% of the electricity generating capacity brought online in March was solar. This likely has more to do with the absence of non-solar projects coming online in March. For the first quarter, representing January through March, 2013, solar represented 29% of the generating capacity brought online, and wind represented 51% of the generating capacity brought on line, with natural gas representing most of the remaining capacity brought online, 18%.
Here is a summary of the solar projects brought online in March, provided by FERC's Office of Energy Projects:
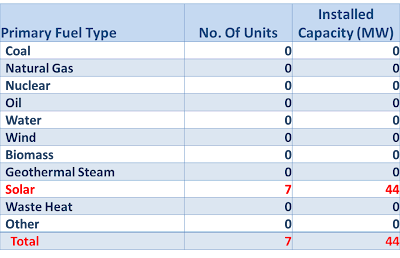
Here is a summary of the solar projects brought online in March, provided by FERC's Office of Energy Projects:
- NRG Energy Inc’s 26 MW Borrego Solar in San Diego County, CA is online. A second phase with 15 MW is expected to come online in June, 2013. The electricity generated is sold to San Diego G&E under long-term contract.
- City of Las Vegas’ 3 MW Las Vegas Waste Water Treatment Plant Solar in Clark County, NV is online. The electricity generated will supply 20 percent of the power needed by the nearby Water Pollution Control Facility.
- KDC Solar LLC’s 5 MW North Jersey Media Group Rockaway Solar in Morris County, NJ is online. The electricity generated will supply 60 percent of the power needed by North Jersey Media Group’s Rockaway printing plant.
- Two solar projects online in HI: 1) 6 MW Kalaeloa Solar One in Honolulu County. The electricity generated is sold to Hawaii Electric Company under longer-term contract. 2) 1.9 MW Bosch Maui County Solar in Maui. The electricity generated will supply 11 municipal facilities.
- BLU Leaf Energy Inc’s 1.15 MW Tanque Verde Unified School District Solar in Pima County, AZ is online. The electricity generated is sold to the school district under long-term contract.
- Weaver Cooke Construction’s 1.3 MW Greensboro Natural Science Center in Guilford County, NC is online. The electricity generated is sold to Duke Energy Carolinas under long-term contract.
Georgia Tech Builds Interactive GIS System for Analyzing United States Tidal Power Resources - Available for Public Use
Assessment of Energy Production Potential from Tidal Streams in the United States
Click on the image below to go to the Georgia Tech interactive GIS system.
Click on the image below to go to the Georgia Tech interactive GIS system.
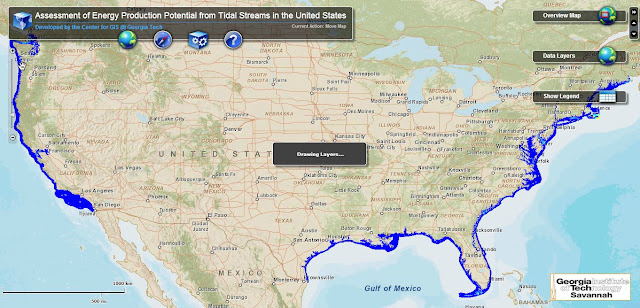
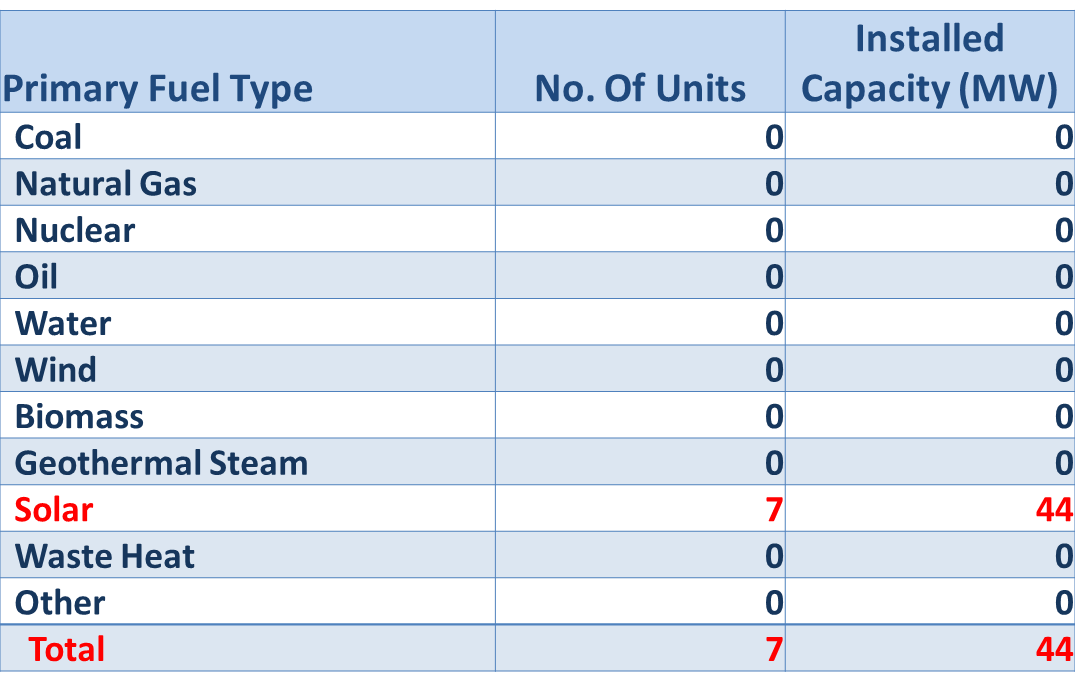
Thursday, April 11, 2013
Bitcoin Prices Tumble 40% on Wild Trading Day After Rising 1561% in 3 Months
Bitcoins have been on an upsurge in recent months, rising 1561% from $14 per Bitcoin on January 1, 2013, to a high of $237 per Bitcoin on May 4, as seen in the chart below.

With the price rising to stratospheric levels, there was only one possible outcome, which is a radical return to earth. This took place yesterday, on April 10, 2013, with a radical pull back in prices. The chart below shows the minute by minute trading in Bitcoins on April 10, 2013. Over a four hour period, Bitcoins lost 40% of their value, moving from $250 to approximately $100, before settling at the end of the trading day at around $175. Quite a wild ride for any traded commodity.
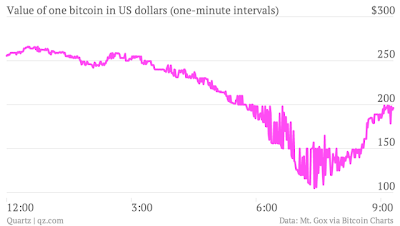

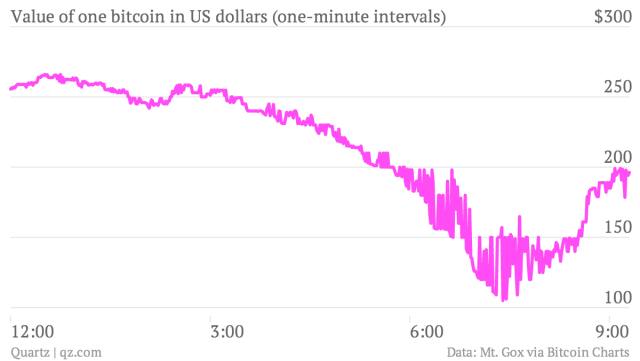
Tuesday, April 9, 2013
Trade Deficit Narrows while Labor Force Participation Drops To Levels Not Seen Since 1979!
Two pieces of economic data stood out this week. On a favorable note, the United States trade deficit narrowed by 3.4% from January, to $43 billion, with exports climbing to near record levels. Exports rose to $186 billion, with strong exports of energy products and automobiles. Imports were little changed, with crude oil imports at their lowest levels since March, 1996.
Energy plays a central role contributing to the reduction in the deficit, with energy exports increasing on one hand, and energy imports at their lowest level in 17 years. The reduction in crude oil imports is occurring for several reasons. As referenced in an earlier blog on transportation, the number of vehicle miles driven has been reducing for several years, at the same time that vehicle efficiency has been going up. In addition to reduced oil consumption for transportation, the United States has been incrementally increasing our own production of oil domestically. These two factors have contributed to dampen and reduce the need and demand for crude oil imports.

Another piece of economic news which stood out this week is the continued reduction in the overall labor force participation rate, explaining for the corresponding reduction in the nation's unemployment rate. The labor force participation hit 63.3% in March this year, a level not seen since 1979. Labor force participation peaked in 2000 at 67.3%, and has been declining ever since.
There is some uncertainty as to the cause of the reduction, with some referring to baby boomers leaving the work force, while others are giving up on being active in the job market, choosing to return to school, or stay on the labor force sidelines. A structural shift appears to be taking place in the economy relative to the labor force. The types of jobs being offered have transitioned to lower wage jobs and part time jobs. Many who are unemployed are dragging their feet in taking less attractive or part time positions. We have seen higher wage manufacturing jobs being replaced with lower wage service sector jobs. In addition, we have been seeing governments at the national, state and local levels reducing their employment levels.
There is another factor impacting the labor force. Corporations, in order to maintain or improve profits with increased costs for energy, are turning to counterbalancing labor force reductions, substituting capital investment in improved productivity while simultaneously outsourcing lower margin activities. These moves have allowed corporations to maintain or improve earning under scenarios with increased energy costs, leaving the labor force behind.

Subscribe to:
Posts (Atom)