Monday, October 21, 2013

Dollar Will Continue to Strengthen With Softening Global Economy and Continued Weak Demand for Oil

As seen in the accompanying chart, the recent decline in oil prices correlates well with recent surge in the value of the dollar.  The trade weighted dollar index hit a low of 94 in July 2011, and has recently surged to a high of 103 in September 2013, an increase in value of 9.6%.  Over that same period of time, Brent crude spot oil prices hit a peak of $126 per barrel in April, 2012, and have since fallen to a low of $100 in October, 2013, representing a 20.6% decline in cost.  On initial observation, the current directional trend appears to be a continuing strengthening of the dollar and a continued decline in oil prices.

Factors resulting in a general tempering of the global demand for oil exogenous to the US economy include recent tempering of the Chinese economy, a cool down of India's economy, and a  general sluggishness across the globe of what were previously economies exhibiting higher growth rates.

According to the Bureau of Economic Analysis, the US economy grew by 2.8% in 2012.  The Conference Board forecasts a rather tepid growth of 1.5% in the US economy in 2013.  This level of growth is corroborated by a third quarter 2013 survey of 41 forecasters by the Federal Reserve Bank of Philadelphia, with a consensus forecast of 1.5% GDP growth for 2013.

The International Monetary Fund recently reduced its forecast for global growth in 2013 and 2014, pointing out that "Emerging market and developing economy growth rates are now down some three percentage points from 2010 levels, with Brazil, China and India accounting for two thirds of the decline."

These declines in global economic growth rates contribute to a reduced expectation for oil market pressures, and a corresponding reduction in oil prices.  It may just be that these reductions in market pressures for oil are an important contributing factor in the recent run-up in the value of the dollar. With a continued expected sluggishness if not softening of the global economy, we are likely to see continued reduction in oil prices and an increase in the value of the dollar.


Monday, October 14, 2013

China Surpasses the United States as the World's Largest Oil Importer

According to EIA's monthly Short Term Energy and Winter Fuels Outlook, China surpassed the United States in September, 2013 as the world's largest importer of petroleum.


Tuesday, October 1, 2013

Worldwide Installed Capacity of Wind Power To Blow Past Nuclear

Frequently, nuclear is held out as a carbon-free scalable technology, which it definitely is.  It may seem to some, however, that there is an implied differentiation that frequently accompanies these statements, implying that technologies such as wind and solar are not scalable, and hence less feasible when compared to nuclear.  Without getting into the details, I would like to share the following chart, which shows the global installed capacity of nuclear power and wind power.

What the chart shows, empirically, is that whether or not wind is scalable compared to nuclear, it will surpass nuclear as a major global power source, perhaps as soon as within the next two years.  Perhaps this implies that wind is a scalable power technology, although what is likely meant by scalable is very large central plants.  Being a distributed or diffuse power source does not seem to stand in the way of unprecedented growth of windpower.


Sunday, June 30, 2013

Leveraged Growth Strategies

Are You Achieving Your Growth Targets? 

Setting growth targets is easy - achieving growth targets is difficult.  Why aren't you hitting your growth targets?  Many companies are challenged in achieving their growth targets, whether emerging enterprises or established businesses.  Customer preferences shift, new technologies are introduced, regulations change.  Competitors lower productions costs or increase performance and functionality, and new entrants introduce disruptive business models.  For emerging enterprises, and established companies introducing new business units or products, the challenges of deciding what to offer, which customers to target, and how to successfully position against the competition is daunting.

A Leveraged Growth Strategy reduces uncertainty and creates organizational focus for developing and implementing successful growth strategies.

Have You Identified Your Most Important Unanswered Questions?

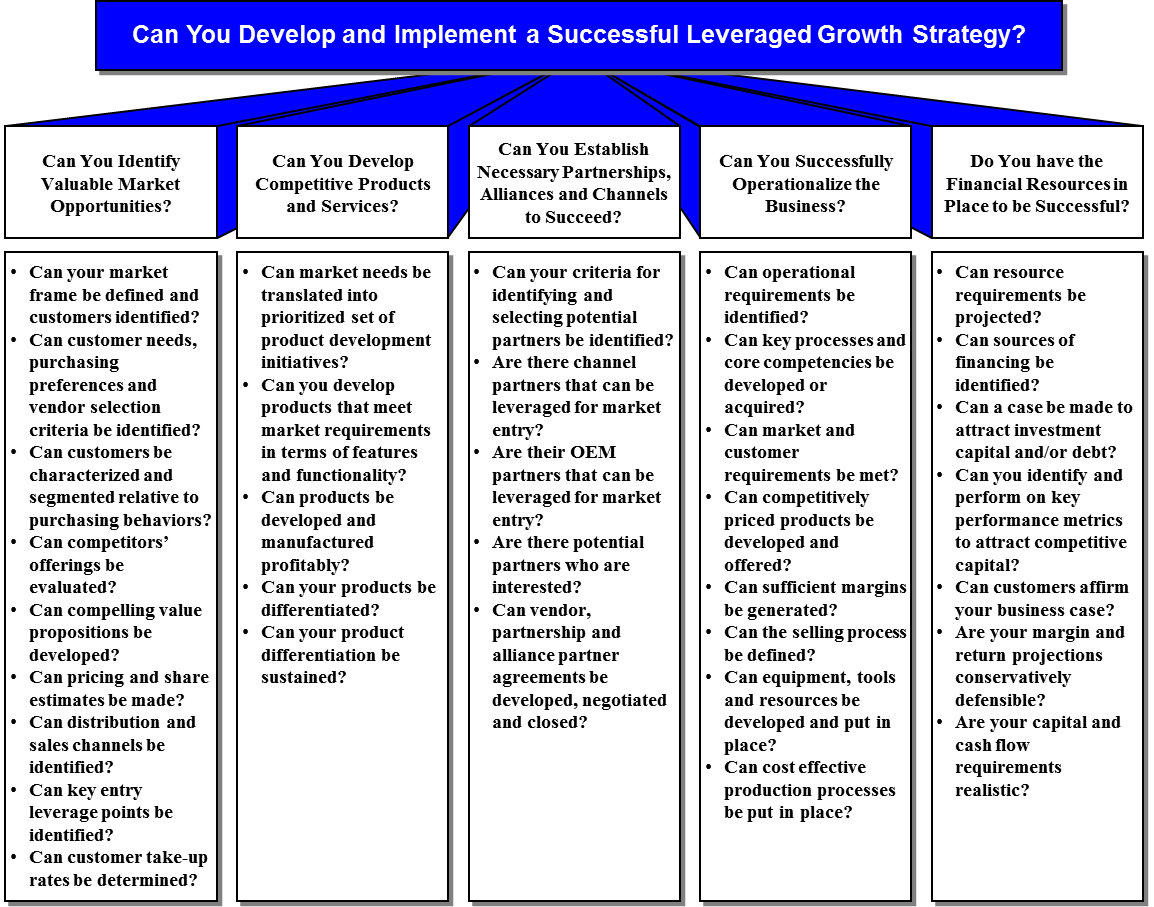
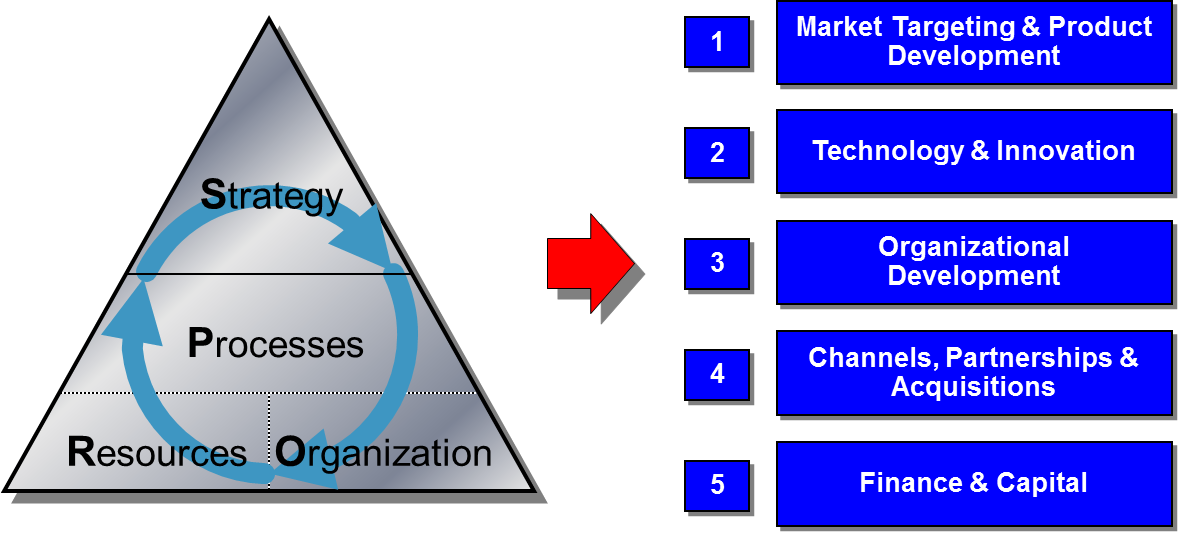
Developing a leveraged growth strategy begins with sweeping out the corners with your team and stakeholders, making sure that you have the right questions in front of your before you start looking for answers.  The approach that is best to determine your critical questions is conducting an issues analysis.  An illustrative issues analysis is provided below.


Issues analysis begins with brainstorming unanswered questions.  Each member of a team independently writes down unanswered questions on sticky notes, and the sticky notes are placed up on a wall.  The individual sticky notes are organized dynamically in two ways.  First, they are grouped into like questions.  Market questions are grouped together, finance questions are grouped together, operations questions are grouped together, etc.

Then the stickies are placed in hierarchies, with the higher order and broader questions grouped near the top, and subsidiary questions placed lower on the wall.  Overlapping or duplicitous questions are removed, and remaining questions are consolidated.

Issues analysis consists of yes or no questions, with the requirement that all questions in the hierarchy have to be answered in the affirmative, starting at the lowest level and moving up.  Only when all questions are answered in the affirmative will the single highest order question be answered in the affirmative.

The reason for preparing the issues analysis is to identify the key questions that have to be answered before you can have a growth strategy.  It creates focus on critical questions and can be used as a check list for developing your organization's growth strategy.  

Does Your Team Have Shared Ambitions and Objectives?

To successfully implement any strategy at the back-end requires buy-in and commitment to the objectives and process at the beginning.  This is the strongest argument for frequent communication, and, more importantly, broad participation.

Ambition driven strategy is distinct and different from incremental strategy.  Where does your organization want to be in five years?  What is your specific vision for your organization?  Begin with a draft vision, and work it really hard with your leadership team to determine the specific picture of where you want to be in five years.  The vision is defined by very specific metrics, such as the number of customers, the mix of customers,   revenues, number of products and services offered, the scale of the organization in terms of employee count, scale and type of plant and equipment, and operating earnings and profits.  

Once the five year vision of your organization is well defined and agreed to by the leadership team, you can then connect the dots, assessing how far your existing products and services will get you to your five year target.  The gap in your revenues forms the basis and reason for putting in place a leveraged growth strategy.

Do You Have A Process to Prioritize Growth Opportunities?

This next phase is the core of developing a leveraged growth strategy.  Prior to getting deep into brainstorming and characterizing specific growth opportunities, the first step is to define your opportunity evaluation criteria, considering both fit criteria and attractiveness criteria.

Attractiveness criteria is focused on the market-facing opportunity, separate from your company.  It is looking at markets as anyone would look at markets.  Criteria is used for comparing market opportunities, in order to rank order your specific market opportunities.  The objective is to identify four to six specific opportunity attractiveness criteria.  Illustrative criteria include market size, market growth rate, profitability, competitive intensity, ability to reach, etc.

Fit criteria is absolutely necessary for developing a leveraged growth strategy.  The fit criteria is focused on criteria specific to your organization's leverageable assets, competencies and capabilities, and your goals and objectives.  Setting fit criteria is what distinguished this process from other strategy development processes.

The challenges of entering new markets are quite severe, and require entering with all of the competitive advantages as possible.  This includes entering markets with which you bring specific skills and competencies along with you.  If you enter a market, and establish a new business opportunity that is too far off your core competencies, your likelihood for success is extremely low, no matter how attractive the market opportunity might be.

During the nineteen-nineties, utility companies, faced with deregulation, began entering competitive markets, including cable television.  Cable television was originally considered very similar to the utilities' core businesses, namely pipes and wires.  At the end of the day, however, the cable business has a huge customer service component, with frequent changes to service offerings and very frequent customer contacts.  This level of customer interactions was completely different business model than the regulated utility business, and utilities exited the business.

Setting the fit criteria begins with listing you strengths, unique competencies and capabilities.  Illustrative fit criteria includes leveraging strengths, achieves growth objectives, provides opportunity for sustainable competitive advantage, achievable within certain capital and cash flow boundaries, etc.


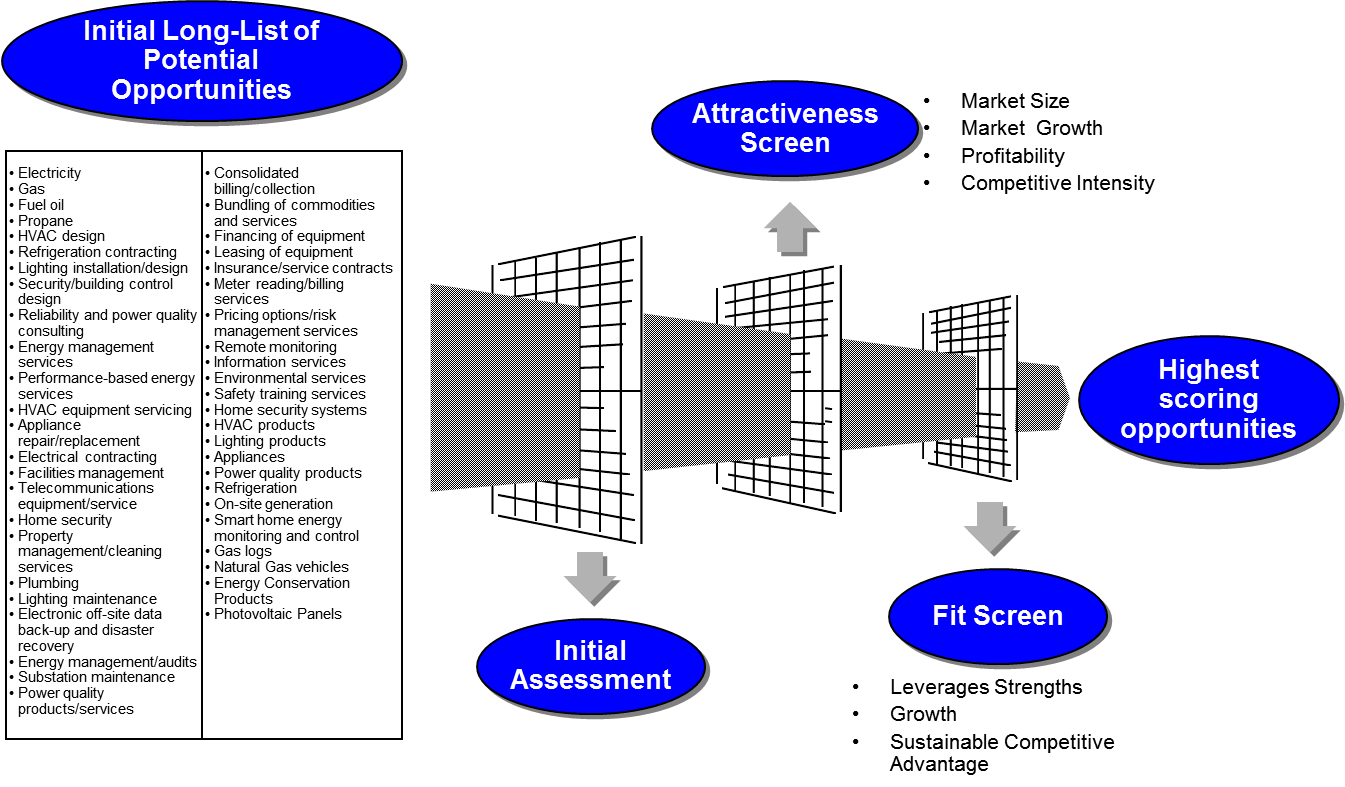
The screening process begins with conducting an open brainstorming process with your team.  No idea is to be discounted at the outset.  It is important for each opportunity to be sufficiently defined and characterized, so that all members of the team understand what the opportunity is.  Each opportunity needs a name and a brief characterization.

The first screening is a very high level screening to assess the broad test for sanity and the alignment with the company's overall strategy.  This screening may reduce the number of opportunities by one-quarter to one-third, for example.  It is really just a reasonableness screen.

Once the initial screening is complete, the remaining opportunities need to be characterized, in short order and on a preliminary basis, with respect to the fit and attractiveness criteria.  This can usually be done in a table format, in a matrix of the opportunities matrixed against the fit and attractiveness criteria.  The task can be assigned to multiple team members in order to spread the work requirements and facilitate the process of filling out each spare in the matrix.

The next step is the assignment of numerical scoring values for each opportunity by each fit and attractiveness criteria.  The purpose for scoring is to distinguish between opportunities.  Absolute precision is not needed nor called for at this stage.  The scoring shall use numbers between the values of one and five, with five representing the highest value, indicating the highest relative fit or the highest relative attractiveness.

In addition to the scoring system, each of the criteria can have overall weighting.  This is not always necessary, and is usually called for when criteria are significantly more or less pertinent or valuable when compared to other criteria.  One way to weight specific criteria is to simply apply a numerical value associated with each criteria, between the value of 0.8 for a low weighting, and 1.2 for a high weighting.

Once the scoring criteria have been applied for each opportunity, the average score can be determined for each opportunity, one average number for the fit criteria for each opportunity, and one average number for the attractiveness criteria for each opportunity.

Can You Identify Your Highest Priority Growth Initiatives?

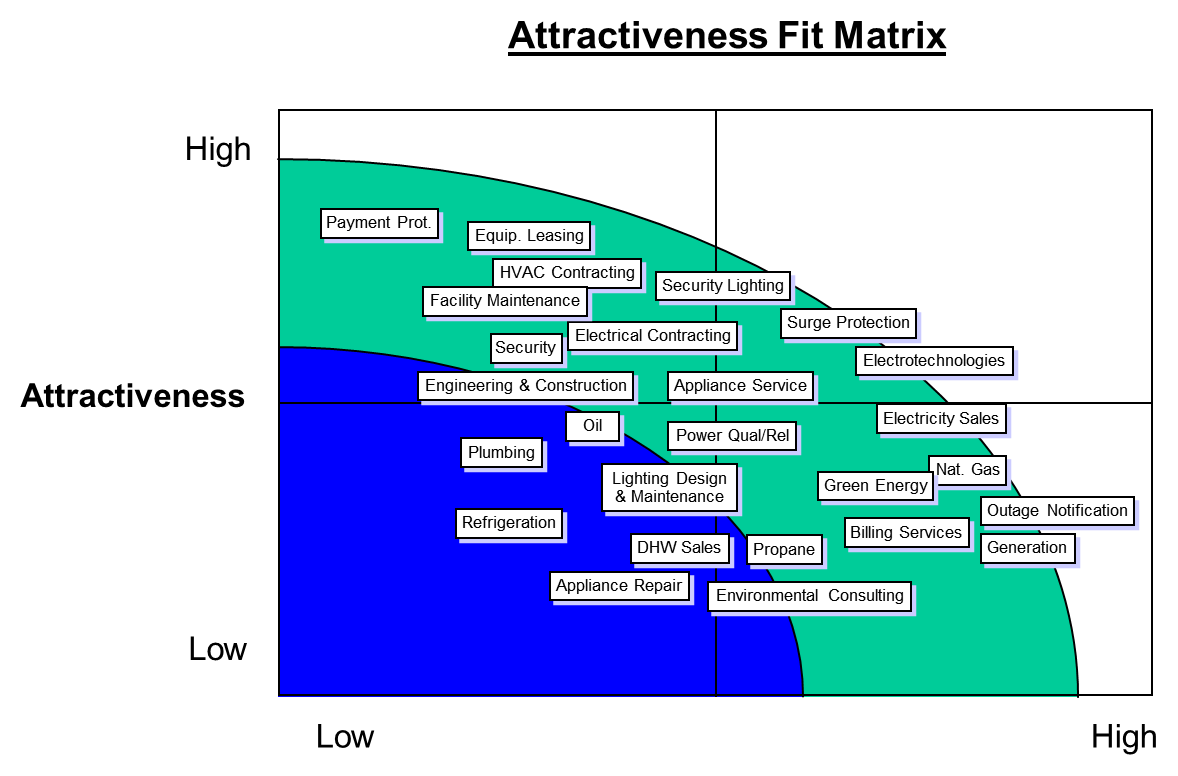
Charting your growth opportunities on an attractiveness-fit chart helps understand your highest priority growth opportunities.  Typically, the opportunities in the top right quadrant, those with the highest fit and the highest attractiveness, are those you want to focus on.  In addition, those that are attractive from a market perspective, yet may not have the highest fit, can also be part of your growth strategy, as those with slightly lower fit scores can move up on fit, as long as you commit to making certain investments in those opportunities.  For example, if a specific business opportunity requires a call center, and you have no call centers or call center experience, you have the opportunity to acquire a call center business, which would increase the fit of the business opportunity substantially.


At this stage in the process, you and your team can select those opportunities you want to develop a cohesive and compelling strategy and business case.

Can You Make Cohesive and Compelling Business Case?

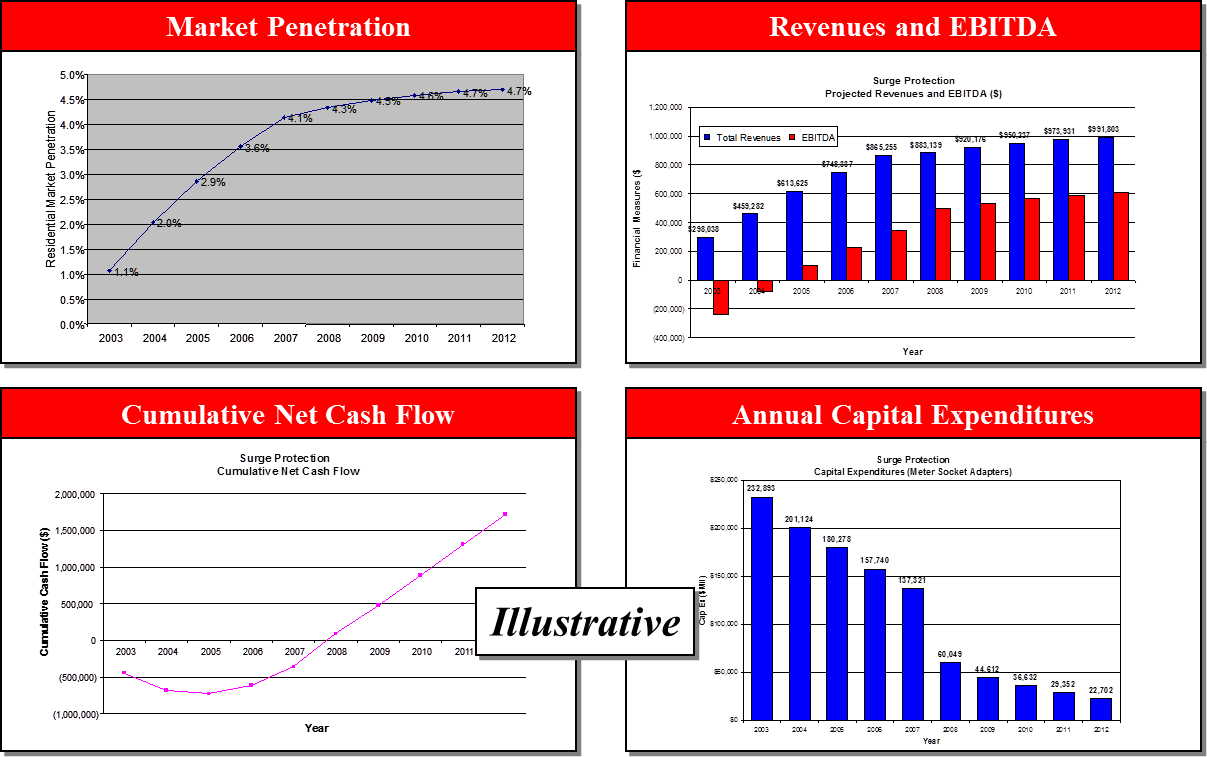
With a refined set of selected opportunities, you can integrate the opportunities into a single business strategy for growth.  Preparing the strategy requires developing business plan summaries for each initiative, including financial projections.  The business case for your growth strategy needs to include an assessment of the market, the products and services offered, customers and market segments targeted, the sales process and plan, the source of competitive advantage and differentiation, the channel and partnering strategy, the infrastructure, business processes and plant a equipment that is required, a staffing plan, a risk analysis and mitigation plan, competitive analysis, a financial plan, and a milestone and performance metrics schedule.


Can You Operationalize the Business?

The final stage is implementation.  Once approvals are in place to go forward, a detailed action plan helps keep the implementation plan on time.  All the details associated with putting a business in place have to be understood in advance, with key roles and responsibilities assigned for implementation, including timelines and due dates.


Post Script - If you want a PDF copy of my Leveraged Growth post, send me an email request to brad(at)velerity.com, and I would be pleased to send you a copy.


Tuesday, April 16, 2013

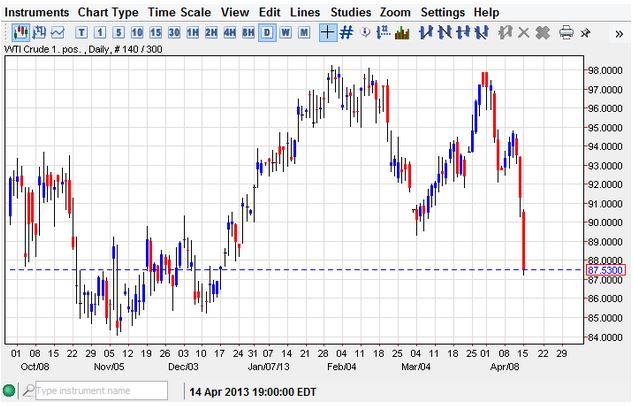
Oil Prices Drop 10% in 2 Weeks, Saving the US $71 Billion Per Year

Oil prices joined gold and other commodities in a full court market swoon, dropping from a high of $98 per barrel two weeks ago, for West Texas Intermediate, to close yesterday at close to $88 per barrel, a 10.2% drop.  With United States oil consumption at 19.6 million barrels per day, this means a savings to our economy of $71.5 billion per year.  Historically, oil prices at the high level that we have seen these past few years have caused recessions in the United States.  The savings to our economy associated with this recent market drop for oil is a benefit to our economy.  

The reason for the downswing in commodities is the galloping sense that the world economy may not be growing as expected, with the specific news Monday morning that China's growth in the first quarter this year was 7.7%, which is below the 7.9% of the last quarter of 2012, and below expectations that it would be closer to 8% in the first quarter of this year.

As a consequence, silver dropped as much as much as 11.5% in markets on Monday, and gold dropped 6.6% on Monday.  As mentioned, oil has dropped 10.5% in the past two weeks.  Below is the chart of WTI crude oil prices from October, 2012 through yesterday, April 15, 2013. Click on image below for larger view of the graph.

Saturday, April 13, 2013

Tidal Power Investment Surging - Commercialization On The Horizon


Tidal energy represents a significant power source, with one estimate of the addressable market being upwards of 3 TeraWatts, according to the IEA.  This corresponds to 60% of the world's currently installed electricity generating capacity of 5.066 TeraWatts.  The level of investment in advanced tidal energy technologies has increased significantly in the past decade, with scale deployments of new technologies currently underway.  There are three major types of tidal power, each with different market sizes, technologies and levels of maturity.

Tidal Barrages
Tidal barrages are the most mature tidal technology, with three major installations around the world with more in the planning stage.  These include the oldest installation, the 240 MW installation in Rance, France; the 17.8 MW Annapolis Royal Generating Station in Annapolis Royal, Canada; and the recently opened 254 MW Sihwa Lake Tidal Power Plant in South Korea.

The Rance tidal barrage, also known as La Rance Power Station, is located in Brittany, France.  The 240 MW installation was completed in 1967 and has several unique features.  It serves as a causeway across the Rance estuary, significantly shortening the drive time along the French coast, between Dinard and St. Malo.  In order to preserve boat access to the inland side of the barrage, a lock system was installed, along with a swing bridge for the roadway.  The plant has 24 turbines, and produces approximately 600 GWh per year.  Although the original cost to construct the facility was high, it has since been paid for, and the current marginal cost is less than that of nuclear power.  The tidal flow in that section of France is approximately 8 meters, which is helpful for tidal power production.  .

The 17.8 MW Annapolis Royal Generating Station is located at the mouth of the Annapolis River on the Bay of Fundy, Nova Scotia, Canada.  It was built over a four year period, and commissioned in 1984.  There are some unique features associated with the facility.  First off, it produces power only on the outgoing tide, allowing the head water basin to fill on the incoming tide, and then producing power over a five hour period on the outgoing tide.  This cycle is repeated roughly twice per day, and produces approximately 80-100 MWhrs per day, depending on the ties.  The tides in the Bay of Fundy average 12 meters, and can be as high as 16 meters.  At the location of the Annapolis station average 7.5 meters, and can rise as high as 12 meters.  

The Annapolis station uses a single-effect turbine, meaning that it generates power flowing in only one direction.  The La Rance station, on the other hand, utilizes a double effect turbine, allowing for the extraction of power on both the incoming and outgoing tides.  It has been best determined that double effect turbines require a higher head than single effect turbines.  For the Annapolis station, it generates power upon conditions where there is at least a 1.6 meter differential between the head pond and sea level.  The Annapolis turbine is quite large, with a 3 meter diameter.

Tidal Current
Tidal current systems are either horizontal axis two and three bladed turbines or vertical axis type turbine designs, known as axial turbines, positioned horizontally.  Tidal current systems are typically secured to or positioned on the sea floor in arrays.  These systems are just now emerging, with two designs having completed scale deployments and are taking commercial orders.  The two most mature designs include the 1.2 MW SeaGen system in Strangford Lough in Northern Ireland; and the 180 kW TidGen deployment in Cobscook Bay, near Eastport, Maine.

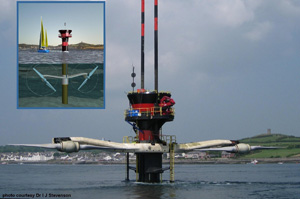
The 1.2 MW SeaGen system in Strangford Lough in Northern Ireland was deployed in 2008, and has been in operation and under extensive testing since that time.  The design is a monopole support, anchored to the sea floor, with a horizontal strut that supports two horizontal axis rotors at opposite ends.  The rotors themselves have the highest weep area of any deployed system, of 402 square meters for the pair of rotors.  Each rotor is 16 meters in diameter and spins at 14 rpm.  

The system cost $18.36 million.  The cross beam is designed to be raised and lowered to facilitate maintenance.  The system is at the mouth of the Strangford Lough, or Loch, Southwest of Belfast, which encompasses 105 square kilometers of water, one of the largest coastal bays.  The system produces up to 6,000 MWhrs per year, according to the company’s web site, corresponding to a 57% capacity factor, which is much higher than wind or solar.

The pitch of the blades can be adjusted up to 180 degrees, allowing for bidirectional flow and energy capture.  Additionally, the blades are purposefully located in the top third of the water column, where the greatest water flow is found.

The company which manufactured the system is taking its experience and developing a 2 MW system for commercial deployment, with 20 meter diameter blades in a similar configuration.  They are also planning a 3 MW system that is deployed in deeper waters, where the surface is not pierced by the system.  The 3 MW design is in the very early stages of design at this time.

The 180 kW TidGen tidal generating system was deployed in Cobscook Bay, near Eastport, Maine, in August, 2012.  The turbines are axial turbines, utilizing a blade design that appears to be similar to the twisting of DNA strands, with the axis horizontal and perpendicular to the flow of the water.  The TidGen system utilizes a blade structure that is 98 feet long and 16 feet high in cross section.  The system is designed to produce 180 kW at rated output, and plans are in place to increase the number of turbine systems deployed to produce 5 MW, requiring, as it appears, the deployment of 28 TidGen systems.

Tidal Lagoons
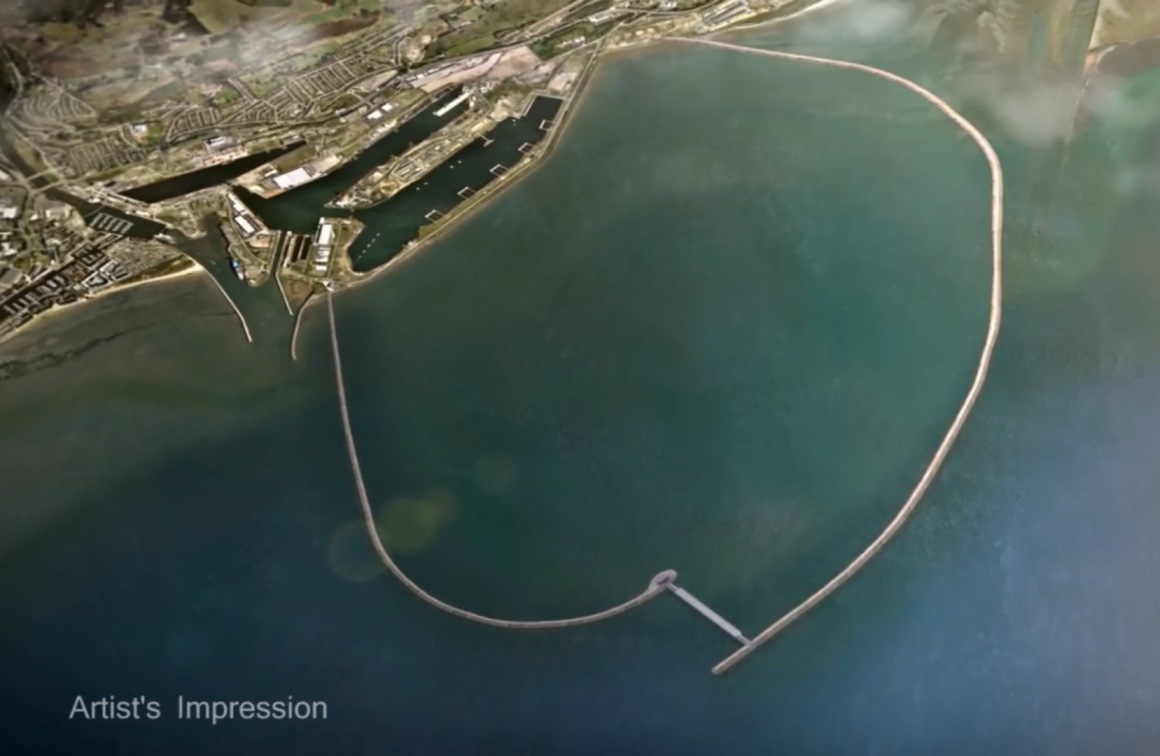
Tidal lagoons are large shallow areas defined by perimeter barriers, with a sluice way with turbines to generate power.  There are no tidal lagoons currently built, although there are two major designs on the drawing board.  One is the proposed 250 MW Swansea tidal lagoon in Swansea, UK.  The other is the 300 MW near the mouth of the Yalu River in China.  Tidal lagoons are expensive to build, but have higher capacity factors, of about 62%.

The proposed 250 MW Swansea tidal lagoon is an ambitious project proposed in Swansea England.  The system relies on approximately 7 miles of barrages to be built, to create the lagoon.  The expected cost of the project is $841 million.  The system is designed to generate power on both the incoming and outgoing tides, estimated to operate for 16 hours per day.

Friday, April 12, 2013

US New Electric Generating Capacity Brought Online in March, 2013 is 100% Solar!


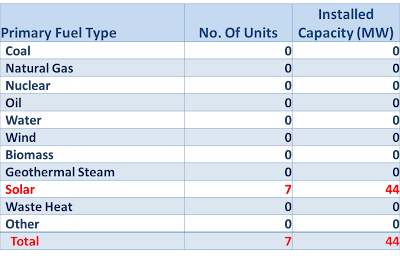
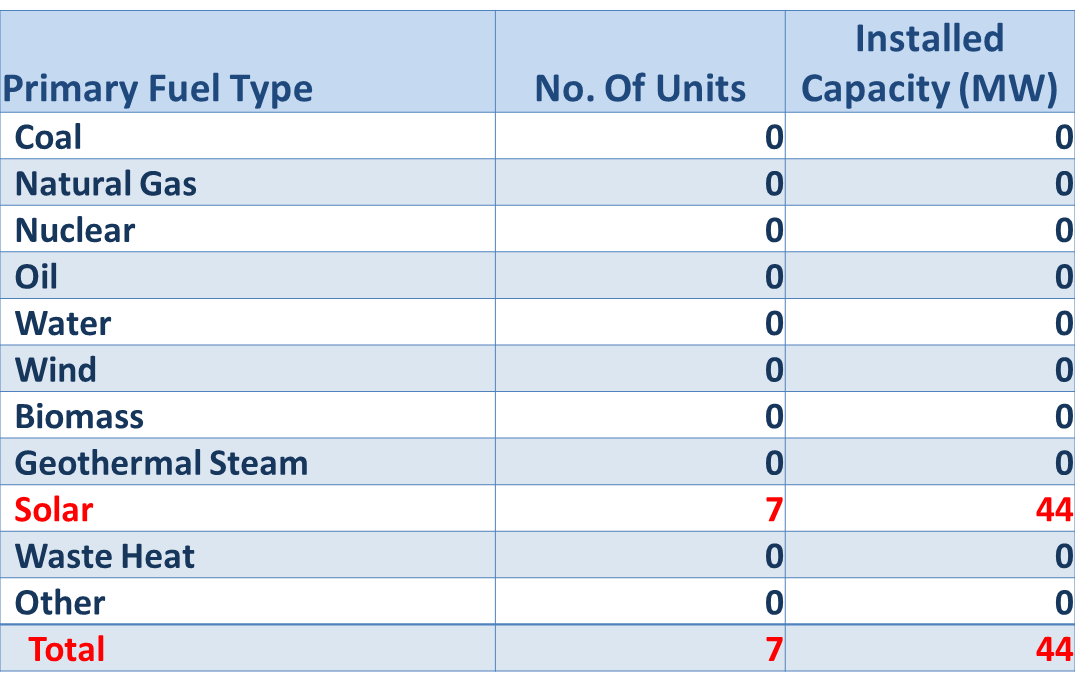
According to FERC's Office of Energy Projects, 100% of the electricity generating capacity brought online in March was solar.  This likely has more to do with the absence of non-solar projects coming online in March. For the first quarter, representing January through March, 2013, solar represented 29% of the generating capacity brought online, and wind represented 51% of the generating capacity brought on line, with natural gas representing most of the remaining capacity brought online, 18%.


Here is a summary of the solar projects brought online in March, provided by FERC's Office of Energy Projects:

  • NRG Energy Inc’s 26 MW Borrego Solar in San Diego County, CA is online. A second phase with 15 MW is expected to come online in June, 2013. The electricity generated is sold to San Diego G&E under long-term contract.
  • City of Las Vegas’ 3 MW Las Vegas Waste Water Treatment Plant Solar in Clark County, NV is online. The electricity generated will supply 20 percent of the power needed by the nearby Water Pollution Control Facility.
  • KDC Solar LLC’s 5 MW North Jersey Media Group Rockaway Solar in Morris County, NJ is online. The electricity generated will supply 60 percent of the power needed by North Jersey Media Group’s Rockaway printing plant.
  • Two solar projects online in HI: 1) 6 MW Kalaeloa Solar One in Honolulu County. The electricity generated is sold to Hawaii Electric Company under longer-term contract. 2) 1.9 MW Bosch Maui County Solar in Maui. The electricity generated will supply 11 municipal facilities.
  • BLU Leaf Energy Inc’s 1.15 MW Tanque Verde Unified School District Solar in Pima County, AZ is online. The electricity generated is sold to the school district under long-term contract.
  • Weaver Cooke Construction’s 1.3 MW Greensboro Natural Science Center in Guilford County, NC is online. The electricity generated is sold to Duke Energy Carolinas under long-term contract.


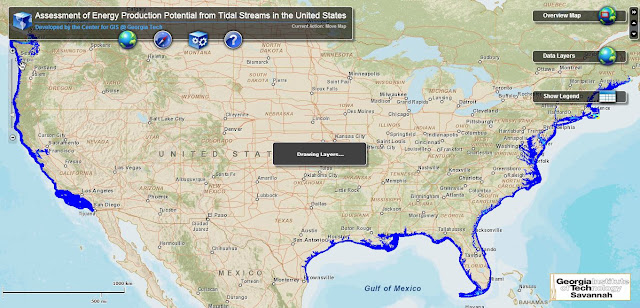
Georgia Tech Builds Interactive GIS System for Analyzing United States Tidal Power Resources - Available for Public Use

Assessment of Energy Production Potential from Tidal Streams in the United States
Click on the image below to go to the Georgia Tech interactive GIS system.  

Thursday, April 11, 2013

Bitcoin Prices Tumble 40% on Wild Trading Day After Rising 1561% in 3 Months

Bitcoins have been on an upsurge in recent months, rising 1561% from $14 per Bitcoin on January 1, 2013, to a high of $237 per Bitcoin on May 4, as seen in the chart below.


With the price rising to stratospheric levels, there was only one possible outcome, which is a radical return to earth.  This took place yesterday, on April 10, 2013, with a radical pull back in prices.  The chart below shows the minute by minute trading in Bitcoins on April 10, 2013.  Over a four hour period, Bitcoins lost 40% of their value, moving from $250 to approximately $100, before settling at the end of the trading day at around $175.  Quite a wild ride for any traded commodity.


Tuesday, April 9, 2013

Trade Deficit Narrows while Labor Force Participation Drops To Levels Not Seen Since 1979!

Two pieces of economic data stood out this week.  On a favorable note, the United States trade deficit narrowed by 3.4% from January, to $43 billion, with exports climbing to near record levels.  Exports rose to  $186 billion, with strong exports of energy products and automobiles.  Imports were little changed, with crude oil imports at their lowest levels since March, 1996.

Energy plays a central role contributing to the reduction in the deficit, with energy exports increasing on one hand, and energy imports at their lowest level in 17 years.  The reduction in crude oil imports is occurring for several reasons.  As referenced in an earlier blog on transportation, the number of vehicle miles driven has been reducing for several years, at the same time that vehicle efficiency has been going up.  In addition to reduced oil consumption for transportation, the United States has been incrementally increasing our own production of oil domestically.  These two factors have contributed to dampen and reduce the need and demand for crude oil imports.  


Another piece of economic news which stood out this week is the continued reduction in the overall labor force participation rate, explaining for the corresponding reduction in the nation's unemployment rate.  The labor force participation hit 63.3% in March this year, a level not seen since 1979.  Labor force participation peaked in 2000 at 67.3%, and has been declining ever since.

There is some uncertainty as to the cause of the reduction, with some referring to baby boomers leaving the work force, while others are giving up on being active in the job market, choosing to return to school, or stay on the labor force sidelines.  A structural shift appears to be taking place in the economy relative to the labor force.  The types of jobs being offered have transitioned to lower wage jobs and part time jobs.  Many who are unemployed are dragging their feet in taking  less attractive or part time positions.  We have seen higher wage manufacturing jobs being replaced with lower wage service sector jobs.  In addition, we have been seeing governments at the national, state and local levels reducing their employment levels.

There is another factor impacting the labor force.  Corporations, in order to maintain or improve profits with increased costs for energy, are turning to counterbalancing labor force reductions, substituting capital investment in improved productivity while simultaneously outsourcing lower margin activities.  These moves have allowed corporations to maintain or improve earning under scenarios with increased energy costs, leaving the labor force behind.