Thursday, November 27, 2008

Providing Economic Assistance to the Automobile Industry

The American automobile industry is facing a time of unique and extraordinary challenges, with a potentially devastating outcome.  Close to three million jobs are tied to the big three automakers when including 250,000 direct employees, approximately 500,000 jobs with suppliers and several million additional jobs that support both the industry and the suppliers.  

The challenges that the industry is facing include consumers switching away from highly profitable SUVs to more efficient vehicles, the precipitous drop in automobile purchases from approximately 16 million vehicles per year to 12 million per year, the abrupt change in capital markets, and high cost structures related to a variety of agreements in place.

Our purpose is to put America back to work while encouraging innovation that creates sustainable commercial opportunities for all Americans, and strengthens our collective economic well being.   In Germany, as part of the economic recovery plan, the government has provided incentives to consumers to purchase automobiles.  This type of market and consumer driven financial incentives would contribute the fastest towards supporting the industry and encouraging commercial transactions.  

One approach is to provide a direct financial rebate of $1,000 for each American manufactured vehicle purchased that exceeds 30 mpg highway, with an additional incentive of $400 per mpg highway over 30 mpg, to a maximum of $5,000 total combined rebate amount per vehicle.  If this constitutes 4 million vehicles per year, the rebate amounts would add up to approximately $10 billion per year.


Saturday, November 8, 2008

Obama's Transformational Clean Energy Plan

Introduction
The importance of clean energy has increased in the Obama administration's plans since the election.  This is due to the central importance of clean energy in the administration's economic revitalization plan.  The central position of clean energy to the economic revitalization of our country is warranted, given the significant economic leverage provided by certain clean energy investments.  This also speaks to the unique role and ability of government, to focus on coalescing forces that would otherwise not be brought to bear.  prioritization / act where others would not act / national security

Obama's Energy Economic Revitalization Plan
There are three energy elements as part of the Obama economic revitalization plan, including a $150 billion investment initiative, a new jobs training program, and incentives to boost the renewable energy sector to create jobs.   A summary of the initiatives follow: 

(1)  Invest In A Clean Energy Economy And Create 5 Million Green Jobs - The Obama administration plans to invest $150 billion over ten years in several clean energy areas, including biofuels, plug-in hybrids, commercial scale renewable energy, low emissions coal plants, and the transition to a new digital electric grid.  

(2)  Create New Job Training Programs for Clean Technologies - Increase federal funding for federal workforce training programs addressing clean energy technologies and skills, including advanced manufacturing and weatherization, to help participants find and retain stable and high-paying green collar jobs. 

(3)  Boost the Renewable Energy Sector and Create New Jobs - The Obama administration s planning on creating new federal programs and expanding existing programs that accelerate the development and deployment of renewable energy to create jobs in the clean energy sector.  Two specific areas identified include creating a federal Renewable Portfolio Standard that will require 25% of American electricity to be derived from from renewable sources by 2025.   The implementation of the federal RPS is expected to generate hundreds of thousands of new jobs.  The other major initiative identified by the Obama administration is the extension of the existing  Production Tax Credit, to eliminate the swings in capital investments in wind and solar from uncertainty by investors in the continuity of the ITC.   

The Obama Energy Plan

The Obama administration has made energy policy a cornerstone of their agenda.  They have developed a comprehensive and detailed approach to enhance America's energy future from a jobs, security and environmental perspective.  It appears that the administration will accelerate the deployment of the plan's initiatives that directly create jobs, sequencing the implementation of the other parts of the plan.  Below is a summary of the plan.  A more detailed synopsis will be provided at a later date.    

  • Provide short-term relief to American families facing pain at the pump
  • Help create five million new jobs by strategically investing $150 billion over the next ten years to catalyze private effots to build a clean energy future
  • Within 10 years save more oil than we currently import from the Middle East and Venezuela
  • Put 1 million Plug-In Hybrid cars – cars that can get up to 150 miles per gallon – on the road by 2015, cars that we will work to make sure are built here in America
  • Ensure that 10 percent of our electricity comes from renewable sources by 2012, and 25 percent by 2025
  • Implement an economy-wide cap-and-trade program to reduce greenhouse gas emissions 80 percent by 2050


Tuesday, October 28, 2008

The Economic Wisdom of Clean Energy

Clean energy offers the best chance we have in this country to take back our future, to create jobs, improve our economy, while enhancing our national security and permanently improving our environment.  The role of government is primarily to secure the national defense, to uniquely act in the collective national interest.  Similarly, the federal government plays a role in numerous other situations where the individual rights need to be protected, or standards of well being need to be upheld, such as economic well being or health.  In times of collective economic woe, the government has a responsibility to do what it can to protect the national well being.  This is one of those times and clean energy is the best vehicles to sustain and enhance our collective well being.

Each dollar invested in clean energy creates jobs, stabilizes and reduces our energy costs, increases productivity, reduces our foreign dependance on energy, creates exportable products and services, enhances our balance of trade, and significantly improves our environment.  The key differentiation with clean energy investments is the significant economic leverage achieved compared to any other investment, known in economic circles as velocity.  In aggregate, any dollar invested by the government usually has one dollar less of velocity as compared to a similar investment by the private sector.  Government begins in a disadvantaged position, caused by the tax effect on money.  Any investment on the part of government, therefore, must really bring unique advantage and not be duplicated in the private sector.  Clean energy fits that paradigm.

This country's clean energy strategy will focus on solutions that are economic, have a large impact, create jobs, increase productivity, improve our balance of trade, and enhance our environment.  The core elements of the three step clean energy strategy include:
  1. Electricity - Accelerate proportion of economic renewable electricity, with a principal focus on enabling wind power.
  2. Transportation - Accelerate the domestic development of very high mileage plug-in hybrids. 
  3. Buildings - Accelerate the adoption of high efficiency end-use central systems, appliances and end-uses, including combined heat and power systems and geothermal heat pumps. 
The first role of government is to reduce the barriers to adoption, by eliminating regulation which discourages or hampers the development of these clean energy sources.  The second role of government is to encourage regulation that enables the development, deployment and adoption of these resources.  This would include tax breaks for developing and deploying these sources of energy.  The third step for government would be to provide financial incentives that directly reduce initial costs, such as tax incentives, rebates and grants.  It is important that the government share of these expenditures be kept low, so as to ensure only the most economic projects are built and that private capital is put to work, leveraging fundamentally scarce public resources. 

Saturday, October 25, 2008

The Significant and Understated Benefits of Energy Price Reductions to the US Economy

As the world economy appears to be lurching towards a recession, the energy economy is experiencing its own share of disruptive and confusing dynamics, with significant changes in prices and demand.  Since the middle of July, commodity prices began falling from their peaks, with baskets of commodities down approximately 50% from July, 2008, through October, 2008 based on a review of information provided by Bloomberg.  Similarly, oil prices also peaked in July, 2008, hitting $137 per barrel on a global basis.   Since that time, oil prices have fallen to close to $60 per barrel on the New York Mercantile Exchange futures market.  

The drop in oil prices has a number of important effects around the world.  Notably, here in the United Sates, consumers have seen retail prices for heating oil and gasoline drop as well, relieving the upward pressure on consumer finances that higher energy prices caused.  According the the Energy Information Agency, retail gasoline prices peaked in July at around $4.10 per gallon, and has since fallen to around $2.80 per gallon.  With each automobile owner driving 12,000 miles per year, and average automobile efficiency around 23 miles per gallon, this price reduction is putting an additional $650 in each driver's pocket, and approximately $1,240 per household.  This reduction also applies to heating oil savings for consumers, further relieving consumer burdens.

For the nation's economy, this reduction in prices helps reduce the country's balance of trade due to oil.  On an annual basis, at the July level of pricing, the annual outflow of expenditures on foreign oil was close to $650 billion per year.  At the October level of pricing, the annual out flow is estimated to $285 billion, a savings of $365 billion.  This benefits our countries balance of trade, which helps the value of the dollar, and reduces upward pressures on interest rates.  

For OPEC countries these significant downward adjustment in pricing has significant impacts.  First, revenues are reduced significantly.  For many OPEC countries, oil revenues are the life blood of their country, with national budgets set with assumptions about future pricing and production levels.  As prices go down, OPEC countries are under significant pressure to maintain revenues, by keeping prices and production up.   

These economic benefits associated with energy price reductions are beneficial to the United States economy, and will soften the economic blow that we are receiving associated with the economic meltdown, adding an additional $1 billion per day of spending power to the people of the United States.  


Saturday, October 11, 2008

The United States: The Saudi Arabia of Wind

Introduction
The United States has the opportunity to meet all of its growing demand for electricity with wind power.  Wind is an economic clean energy source with significant scale, as well as being domestically produced.  It is an important part of our new energy strategy to strengthen our economy, reduce carbon emissions, and enhance our balance of trade, comprised of four fundamental strategies:  (1) Accelerated Renewable Electricity - principally wind as well as biomass and solar; (2) Super Efficient Transportation with plug hyper-hybrids; (3) hyper efficient end-use technologies - focusing on very high efficiency combined heat and power and geothermal heat pumps, along with efficient lighting and appliances; and (4) hyper efficient buildings embracing envelope, controls and systems.  This article focuses on wind.

United States - The Saudi Arabia of Wind
The wind resource in the United States is known as the Saudi Arabia of Wind.  In 2001, Lester Brown of the World Watch Institute referred to the U. S. wind resource as the Saudi Arabia of wind power, identifying three states that could meet 100% of the U.S. electrical requirements:  North Dakota, Kansas and Texas.  Lester Brown was writing an article in response to the Bush energy plan of that time, with limited wind.  He considered it a plan for the early twentieth century instead of the twenty-first century because of its emphasis on coal, and diminishment of wind as a resource.  

More recently, there are two prominent players on the national stage that are referring to the Saudi Arabia of Wind, namely T. Boone Pickens and the former governor of Maine, Angus King. The Pickens Plan is promoting a significant wind development project, amounting to  4 gigawatt wind project, five times larger than any other project.  He is developing is project in the Texas Panhandle.  Angus King uses the term as well, referring to the Gulf of Maine as the Saudi Arabia of Wind.  He is developing a project that is a 5 giga watt project off the coast of Maine.  

According to the American Wind Energy Association, the achievable wind resource in the United States is equivalent to twice what we need, with wind able to provide 10.7 trillion kWhs per year, leveraging just the available resources on land.  Most of this resource would be realized in just twenty states.   Simply put, we have an extraordinary amount of available wind resources to drive our economy forward, creating jobs, clean energy and reducing foreign dependancy for our resources.  

Wind Power Economics
Wind is frequently referred to as being competitive with coal power plants.  There are many factors which come into play, which determine the resulting economics of wind power installations.  These factors include site specific influences, specific wind turbine design and size, as well as state and federal incentives.     

Wind Resource - One of the most critical factors impacting the economics of a specific wind development is the location relative to the wind profile.  Wind profiles are categorized by the quality of the wind, represented by seven classes that correlate to Wind Power Density (watts/meter squared).  It is critical that any wind project seek to maximize the potential energy yield based on the wind profile of each  specific location. 

When characterizing the wind resource, the amount of energy in the wind increases with the square of its speed, such that average wind speed is not an adequate measure of the energy potential in the wind.  Also, the wind speed at which the wind turbine cuts in and cuts out is a critical factor in determining how much of the wind resource is realizable.

Wind Turbine - The choice of wind turbine is important in two principal regards - the size of the turbine and its power curve, i.e., rated output at different wind speeds.  In the past ten years, the average size of wind turbines installed in the United States has doubled, from just over 700 kW in 1997 to 1.6 MW in 2006.  These larger wind turbines are more efficient per unit of energy generated per dollar invested due to scale economies, more efficient designs, lower cut in speeds, and lower manufacturing costs.  In the past two years, however, turbine costs have increased along with increased global demand for wind turbines and increasing commodity materials' costs.         

Production Tax Credit - The economics of wind projects are enhanced by the variety of financial incentives provided at state, regional and federal levels.  One of the important economic contributors in the United States is the Renewable Electricity Production Tax Credit.  The PTC provides tax credits on a per kWh basis for specific renewable electricity sources.  The credit for wind is 2 cents per kWh.  

Renewable Portfolio Standards - Currently, 24 states and the District of Columbia have instituted renewable portfolio standards that require electricity generators to provide a specific percentage of their energy in the form of renewable energy.  These 24 states and the District of Columbia represent approximately 50% of all of the electricity consumed in the United States.  RPS requires electricity suppliers to sell an increasing percentage of renewable electricity, which they can satisfy either by producing or purchasing qualifying renewable electricity, purchasing renewable energy credits, or by paying penalties.  In Massachusetts, for example, retail electricity suppliers must provide a minimum of 4% of their retail kWh sales from renewable sources in 2009.  The required percentage is increasing by 1 percentage point each year without end.  RPS standards result in increasing the demand for renewable energy resources, creating a higher market price for wind power.

Renewable Energy Credits, Renewable Energy Certificates, Green Tags and Carbon Offsets - Global warming concerns have resulted in a range of voluntary and compliance initiatives to decarbonize our energy resources and economic activities around the world.  For wind power developers, the opportunity exists to monetize the environmental attributes associated with electricity production.  These environmental attributes can either be retired or applied to meet social or obligatory environmental objectives.  For example, compliance RECs in Connecticut are about $25/MMWh for Tier 1 renewables, and $45/MWh in Massachusetts.  Solar RECs in New Jersey are about $265/MWh, while RECs in Texas are selling for about $5.25, with pricing reported for July, 2008 as reported by Evolution Markets.  Voluntary REC markets are pricing wind from $3 to $9/MWh in regional and National markets (source: Evolution Markets).

Accelerated Depreciation - Wind projects also qualify for 5 year accelerated depreciation schedules.  

Land versus Water - Water based installations are typically more expensive from a capital installation cost perspective than land based installations, yet offer significant counterbalancing financial benefits.  The cost of supporting an ocean based turbine can result in an increase of about 35% to the total cost.  On the other hand, the wind resource in the ocean is typically greater and more consistent, the projects can be much larger, and can be closer to population centers, reducing transmission losses.  For example, the installed cost per kW could be $1,200/kW on land, while costing as much as $1,500/kW in the ocean.  The favorable aspects can more than outweigh the disadvantages, especially with recent advances in sea based tower designs.  

Summary
The results of these economic drivers is that an unsubsidized wind energy project today can produce electricity for about 4 cents per kWh, as compared to 5 cents per kWh  2000, and 40 cents per kWh in 1979.

Wind power installations in the United States are growing at approximately 35-40% per year, with the current installed based of wind power projects exceeds 20,000 MW, with another 9,000 currently under construction, according to the American Wind Energy Association.    


The US Department of Energy, along with AWEA and others now expect that achieving 20% electricity market penetration by 2030 is achievable, representing approximately 300,000 MW of connected load, according to the US DOE and AWEA. Based on recent trends driving wind power costs down, coupled with the identification of large scale locations favorable for development, it is very likely that we will realize an even greater level of wind power in the United States.  The effect of achieving this level of wind power development will be significant in terms of job creation, electricity price stabilization, and environmental benefits.   

Sunday, September 28, 2008

LED Lighting - An Introduction to Super Efficient Lighting

Introduction
LED lighting is the newest lighting innovation, offering lights that last for many years, use as little as one-tenth the energy of normal light bulbs, and contain no environmentally damaging mercury.  Because the technology is both new and different, many questions remain about how to best to use LEDs, what factors to consider when choosing an LED lamp, and what the fundamental product choices are.

Below are two illustrative LEDs.  The one on the left is and example of a bulb design, an HP-Globe 15, a 15 watt LED that produces as much light as an 85 watt incandescent.  The lamp on the right is and HP-10 Flood, which uses only 10 watts to put out as much light as a 50 watt incandescent lamp.
  

LED lighting refers to light-emitting diodes, a technology  originally developed by a British researcher in 1907 (1).  LEDs are semiconductors that emit light when a current is passed through them.  The challenge over the years has been two-fold:  first, the amount of light that LEDs emit has historically been very low, in fact, until recently, the light levels were too low for LEDs to be considered a replacement for standard lighting sources.  Secondly, the color emitted by the LEDs in the visible spectrum has been limited to very specific colors, beginning with red in 1962 followed by yellow and blue.  It has only been in recent years were a variety of colors have been developed, enabling the generation of useful white light, for example.  These innovations in light levels and colors have enabled LEDs to be adopted for use as light sources for illumination in consumer applications. 

Characteristics of LEDs
  • Efficiency - LEDs are much more efficient than both compact fluorescent light bulbs and incandescent light bulbs.  For example, in a typical high use are in your home, a standard 100 watt incandescent light bulb may cost $23.36 to operate for a year, while a comparable compact fluorescent light bulb at 23 watts would cost $5.37 to operate for a year, and a comparable LED at 13 watts would cost $3.04 to operate for a year, saving 87% of your electricity costs!
  • Life - A standard incandescent bulb may operate for only 750 hours, while a compact fluorescent operates and 10,0000 hours, and a comparable LED operates for 50,000 hours.   That basically means that when you buy an LED, you might have it with you for between twenty-five and fifty years.  If you use your LED for four hours per day, every day all year, the bulb will last for at least thirty-four years!  With such a long life, LEDs can be very useful in hard to reach locations where replacement is difficult or costly.  
  • Beam Angle - LED lights are directional lights, meaning that the light is directed in a certain direction.  The most basic application for illuminating LEDs is as spot lights, given the directional or focused nature of the light output.  Consequently, when purchasing LEDs, they may have fewer lumens than a normal lamp, but the same amount of light may be directed to the work surface.  An LED light is usually multiple small LEDs that project a conical shaped light pattern.  In order to have the same dispersion as an incandescent light bulb, a frosted dome is placed over the end of the LED lamp.  This constrains the light output of the LED, but provides a more generally dispersed form of light.  Beam angles can range from 20 degrees up to 180 degrees.  
  • Color - When selecting light bulbs of any type or design, it is important to be aware of your choices with respect to the color characteristics of the lamp.  Light bulbs use a color scale called kelvin, named after Lord Kelvin of Great Britain who developed "an absolute thermometric scale" in 184 equivalent to the scale of degrees celsius, except with the zero point being absolute zero, where all thermal energy of matter drops to zero.   This zero point is approximately equal to 460 degrees below zero on the Fahrenheit scale.   For lighting, the color scale typically runs from 2,500 to 7,000, with color rendition improving from the lower numbers up to the higher numbers.  Compact fluorescents, for example, range from 2,700 to 3,000 kelvin, corresponding to what is referred to as warm light.  Lamps with temperature ranges up to 3,500 kelvin have greater white light and can be good for reading lights.  As the color temperature goes up between 4,000 and 6,500, the light goes from white to blue.   These higher temperature levels are sometimes referred to as "daylight" colors.  
  • Types - LED lights come in several basic types, including bulb lights, flood lights, light bars, and bi-pin bulbs.  What is important to note is that LEDs do not come in dimmable versions, although there are integrated lamp configurations which successively switch off individual diodes.  These types of lamps are used in flashlights and headlamps.  The light bar or strip light types can be good for under cabinets in kitchens, and can also be integrated into light fixtures for task lights used on working surfaces such as desks.  Generally LEDs are good for spot light applications, track lighting, and accent lighting.  
  • Cost -  LEDs are generally expensive, but prices are coming down rapidly, and performance is improving rapidly.  Equivalent replacements for 100 watt light bulbs, for example, can cost between $80 and $120.  These prices are coming down rapidly as performance improves and manufacturing volumes increase.  A key capability that has improved in recent years is light output.  As the lumen levels of LEDs increase, the cost performance is improving.   
  • Emissions - The emissions of LEDs is extremely low compared with other light sources.  In the examples alluded to earlier, the standard 100 watt incandescent bulb, operating for four hours per day, is responsible for close to 200 pounds of CO2 emitted per year.  The corresponding 13 watt LED is responsible for 25 pounds of CO2 emitted per year, a remarkable 87% drop in CO2 emissions per year.  
(1)  http://en.wikipedia.org/wiki/LED

Saturday, September 13, 2008

Creating a Sustainable Transportation Future

Overview
The current transportation system in the United States is not sustainable from an energy, economic,  environmental or global equity perspective.  A wide range of alternatives are being pursued by governments, manufacturers, and consumers to develop meaningful alternatives from plug-hybrids, to ethanol, natural gas and hydrogen.  The use of liquid petroleum dominates the transportation sector due to its astoundingly favorable characteristics - high energy density, easy to transport and use, and reasonably cost effective relative to its utility.  Around the world, the issue of dependance on fossil fuels for transportation is compounded, with high market adoption rates with very little market penetration to date.  

Fundamentally, the position we are in today, with respect to demand frequently outpacing supply, increasingly distorted economic concentration in producing countries, increasing emissions, and increasing prices, will continue to represent the broad trend.  If we think that there is sufficient justification to develop alternative pathways today, the urgency will only increase.  

Energy Use for Transportation
In 2007, 68.3% of our petroleum use in the United States was used for transportation, amounting to 14.12 million barrels per day (mbpd) out of 20.68 mbpd total petroleum consumption in the United States.  Light vehicle consumption, basically the cars and trucks that we all drive, accounts for about 65.2% of the transportation energy consumed, or approximately 9.2 mbpd.  

In the United States, our transportation energy consumption is driven by our choices regarding modes of transportation, the fundamental efficiency of our vehicles, the miles we drive and how we drive with respect to efficiency.  Early in the previous century, the die was cast to facilitate the broad use of automobiles as the dominant mode of transportation in the United States.  Consequently, low oil prices are a cornerstone of the transportation infrastructure that we have developed in the United States.  

When compared to other countries in the world, the United States has some of the lowest oil prices, even considering the recent run up in prices.  Other countries apply high tax rates to  petroleum sales, effectively increasing retail rates significantly.  Based on data from March, 2008, we can see on the following chart that gasoline prices in the United States $3.44 per gallon are still less than half of the gasoline prices when compared to countries in the European Union. 


One of key questions for transportation energy is developing an understanding of switching behavior under conditions of high prices.  One of the facts that people may not remember is the significant reduction of approximately 25% in our national oil consumption over the period from 1978 through 1982.  This significant reduction resulted in a curtailment of national and international demand for oil, reducing oil prices for a prolonged period.  This demand reduction in the late seventies was due to consumers, governments and businesses and utilities instituting new policies and changing buying behaviors and driving habits to reduce oil consumption.     

This year, in 2008, as a result of high oil prices, consumers have been making changes in their purchases and behaviors geared to reducing oil demand, which is having an impact on both aggregate petroleum demand for the United States as well as impacting major United States automobile manufacturers.   In the chart below, from EIA data, we can see that petroleum use for the transportation sector is down year over year, averaging to a 1.4% reduction over the first five months of the year, with May representing a 2.3% reduction on a  year over year basis. 


The short term drop in petroleum consumption in the transportation sector can be attributed to a corresponding drop in vehicle miles driven, as calculated by U.S. Department of Transportation, and presented below.  Based on the first three months of the year, it appears that vehicle miles travelled were reduced by approximately 3.3% on a year of year basis.  


There has also been a marked shift in the types of vehicles that people are purchasing, shifting from trucks and SUVs to small efficient vehicles.

Emission Associated with Transportation
In 2003, transportation accounted for approximately 27% of greenhouse gas emissions in the United States.  As seen in the chart below, transportation is the fastest growing source of emissions in the country.


Each car in the United States, on average, emits about 1 pound of CO2 for each mile driven.  Consequently, if the average person drives 12,000 miles per year, that is equivalent to 12,000 pounds per year, or 6 tons per year.  Multiply this number times 220 million cars in the United States, resulting in approximately 1.3 billion tons per year of CO2 emissions from our cars. 

For the world, we can make some assumptions about the average efficiency (28 mpg) and miles driven (8,000 miles per car) and the number of non-US cars (38 million) which results in 1.2 billion tons of CO2 emissions per year, and a total due to light vehicles in the world of 2.5 trillion tons per year.  The expectation is that the number of vehicles in the world will double in the next 30 years, which would result in emissions of 5 trillion tons o CO2 per year.  If it is assumed that efficiency will improve by 50%,  our global transportation emissions associated with light vehicles will be 3.2 trillion tons per year, a significant increase.   

Transportation is a vexing problem with regards to oil demand and emissions, as the utility of petroleum-based individual transportation is extremely high.  As economies around the world develop, such as China and India, the global demand for vehicles will continue to grow, as will the fundamental demand for petroleum.  

Solutions
The solutions for addressing the economic and emissions issues associated with petroleum-based transportation are many and varied.  There are three fundamental directions - (1)  Improve efficiency of gasoline and diesel-based vehicles; (2) Develop alternative fuel vehicles; and (3) Develop alternative transportation options.  These solutions will be explored in future blogs.   


Friday, September 12, 2008

T. Boone Pickens, Wind Power and the Pickens Plan

In a strange twist, during a time of the highest oil prices ever recorded, an oil man is placing the biggest bet of his life on wind, water and natural gas.  Earlier this year, T. Boone Pickens placed approximately a $1.3 billion order with General Electric for 667 1.5 MW wind turbines, as the first phase of his 4 Giga Watt Pampa Wind Project in the Texas panhandle.  The Pampa Wind Project will be complete by 2014 and will be five time larger than the next largest wind project in the United States.  The overall project is expected to entail an investment of approximately $8 billion over the next six years in installing the wind farm.  But that's not all...

Mr. Pickens is also overlaying additional investments and initiatives to create valuable synergy across his portfolio of investments.  His Pickens Plan is publicly encouraging wind development and the conversion of cars to natural gas.  In addition, he has acquired water rights in the same area as his wind farm.  His Pickens Plan, presented in the public interest, when coupled with his corresponding wind, water and natural gas investments, could be worth billions in coming years.  Below, let's review the magic of Pickens' Synergy.

CREZs - One important innovation aiding Mr. Pickens in his plans is the creation by the Texas Legislature of Competitive Renewable Energy Zones (CREZs) as part of Senate Bill 20.  These CREZs address the critical challenge of linking wind resources to the electric grid, with the identification of 25 zones where wind power could be profitably developed, and having the state agree to build transmission lines out to those zones.  The panhandle is one of those zones, a critical enabling lynchpin in Mr. Pickens' plans.    

PTC - Mr. Pickens is also very supportive of another source of value for his project, the Wind Energy Production Tax Credit, which is expiring at the end of this year.  The  PTC is a tax incentive that was created with the Energy Policy Act of 1992 (EPACT 1992).  The PTC provides an income tax credit of 2 cents per kWh for electricity produced over a ten year period by qualified wind energy facilities and other renewable projects placed in service after December 31, 1992, and before January 1, 2009.  The amount of the tax credit has been adjusted over the years for inflation, with the original credit set at 1.5 cents in 1992.  

Over the years since 1992, the PTC has lapsed three times, each with a significant negative impacts on the level of annual wind plant installations, seen in the chart below from teh American Wind Energy Association (AWEA).  

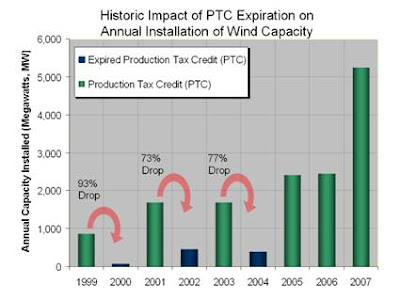
The PTC is currently up for renewal in Congress.  The House has consistently passed PTC language in several bill, but unfortunately the Senate has had a difficult time of it, holding eight votes on legislation incorporating the PTC, but approving the extension on only one occasion.  Apparently, the reason why the Congress has been having a difficult time passing the legislation is not the fundamentals associated with PTC, but it runs counter to a new policy in Congress that requires every spending proposal or tax cut specifically linked either to a spending reduction or a revenue source.  Although this policy was broadly instituted by the Democrats, it is the Republicans that are requiring the identification of a counterbalancing source of revenues for the PTC before providing passage.  The Democrats in his case are arguing that the PTC is grandfathered in, thus obviating the need for applying the offsetting revenue source.  

Water - Pickens has also been buying up water rights in the same area that he is building his wind project, focused in on Roberts County in the northwest portion of the panhandle.   His new company Mesa Water, has purchased the ground water rights of 200,000 acres in Roberts County for $75 million, expecting to make $1 billion over the next 30 years.  His plan is to take water from the Ogallala Aquifer and pipe it to one or more major cities in Texas, distributing approximately 200,000 acre feet per year.  Water below - wind turbines on top.  Interesting source of synergy.

Natural Gas - The Pickens plan also is promoting the move to natural gas based vehicles, to address security and economic issues associated with importing petroleum, and to reduce emissions.  One cannot overlook, however, that Mr. Pickens, through his investment vehicle BP Capital Holdings, owns stock in nine companies involved in natural gas exploration and production amounting to a stock value of $838 million.  Converting 220 million vehicles to run on natural gas would increase natural gas demand by 80% over current demand in the United States of 21.7 trillion cubic feet per year to 39.0 trillion cubic feet.  Even if we converted only 25% of our cars to run on natural gas, this would amount to a 20% increase in demand for a resource that is getting harder to find, and one that is increasingly being sourced globally through importation of liquified natural gas.  

Summary - In summary, Mr. Pickens remains a very astute business person, even in his eighth decade.  He could make a billion dollars off of his wind investment, a billion dollars off of his water investment, and a billion dollars off of his natural gas investment.   Not bad for a reformed oil person who has become a clean energy advocate.


Tuesday, September 9, 2008

The Arctic Ice Cap

The Arctic ice cap is going through a significant transition, represented by the opening of sea lanes around different parts of the polar ice cap, and an overall shrinkage represented by the area of the ice cap.  Many point to the shrinking ice cap as a key leading indicator of the impending devastation associated with the effects of global warming.  The Arctic has caught our imagination, along with the apparent devastating impact the shrinking ice has as the core habitat for polar bears.  What do we know about the Arctic ice situation?  Has it melted before?  What are the implications of the shrinking ice cap on our environment?  Are their longer term implications, or its it a stark harbinger of things to come?

AN excellent source for information about the condition of the Arctic ice cap is the National Snow and Ice Data Center in Boulder, Colorado.  This organization publishes data and images associated with Arctic sea ice on a monthly basis, and has analyzed time series data to ascertain long term tends in addition to the monthly assessments.   

Fundamentally, the arctic ice cap is disappearing.  In the chart below, the average August ice extent was just over 8 million square kilometers, while the average August ice extent in August of this year, 2008, was around 6 million square kilometer, a 25% reduction in ice extent.  The trend corresponds to an average loss of ice in the range of  8.7% reduction per decade.  The prediction is that the sumer ice in the Arctic will completely disappear by about 2030.


Every year, the Arctic sea ice goes through an annual cycle of melting and freezing, reaching its minimum ice level in September.  The lowest level of ice ever recorded took place in September of 2007.  As of September 4, 2008, the amount of ice in the Arctic is above the lowest levels recorded last year but the experts suggest that the daily loss of ice is so high this year, that this year's lowest level may still surpass last year's.  As can e seen in the graph below, the blue line is is getting very close to the dotted line that represents last year's ice extent.  It can also be observed that the amount of ice in September is close to 4 million square kilometers,  which is 50% the average level of ice over the period 1979-2000, suggesting that the complete loss of ice is not outside the realm of possibilities. 
  
The dynamics and implications associated with the melting of the Arctic ice cap are not yet fully understood, although impacts will be felt by animals, additional climate implications and in the political realm.  From the image below, the physical reduction of sea ice can be observed.  One of the implications that has ben mentioned is the impact on polar bears habitat, reducing their habitat and endangering their survival.  With regards to the climate, one of the dynamics is that the ice reflects sunlight back into space.  As the ice disappears, the sunlight that would normally be reflected off the ice is then absorbed by the water, heating up the water.  This is a positive feed back loop in that it accelerates further warming.  The third broad implication is the expanding political positioning around access to the presumed resources in the Arctic ocean.  This political struggle is being pursued by the major countries that ring the pole, namely Canada, Russia and the United States. 


A few final notes.  Because the polar ice cap is floating, its melting will not raise the level of the ocean.  The key source for water that will raise the level of the oceans is the significant amount of freshwater frozen in Greenland.  The ice in Green land is several miles thick, and will have a significantly adverse effect on both the sea level and the dynamics of water flow in the North Atlantic, impacting the Gulf Stream and weather patterns and temperatures for North America and Europe.  Other significant ice melts are occurring in glaciers around the world, further contributing to rising sea levels.  In addition, permafrost around the world is melting, transitioning a great deal of biomass from a frozen state into a non-frozen state.  This biomass will be consumed by microbes that emit methane, further contributing to greenhouse gases and global warming.    

The source for these images, and a great source for additional information, is the National Snow and Ice Data Center, which can be found at the following web address:
http://nsidc.org/index.html


Sunday, September 7, 2008

Peak Oil


Peak Oil has entered the energy lexicon as well as the energy debate.  There are some that feel that global energy production has peaked already, and that we are entering the post oil phase in the grand scheme of energy supply and demand.  The implications of truly achieving peak oil from a production perspective are extraordinary, with impacts and implications that we have not yet begun to fathom , much less experience.  

The other important consideration involving our energy future is the balance, or imbalance, between supply and demand.  The demand for oil is continuing apace around the world, especially as citizens in the emerging economies of China and India yearn to improve their living standards.  The expanding imbalance between supply and demand will impact the economics of oil and energy for years to come in a profound way, with an extraordinary shifting of wealth around the world as never before seen or experienced.  

The earth a big place - is peak oil a reality?  Isn't this simply a matter of supply and demand?  Won't increasing demand drive prices higher, which will cause us to find more of that oil, thus satisfying the increasing demand and moderating prices?  Won't the invisible hand of Adam Smith solve everything?  There is one small consideration that political economists have had difficulty addressing - the stability of republics in times of scarcity.  Will we survive the transition that the apparent scarcity of oil will cause?  Lest I get too far ahead, let's take a look at the fundamentals.

The concept of peak oil was initially proffered by M. King Hubbert in the 1950's, in an article he wrote for a presentation to the American Petroleum Institute in June, 1956.   At the time, Hubbert was the Chief Consultant for General Geology at the Shell Development Company.  Hubbert's research was focused on understanding production levels  over time of exhaustible resources, namely fossil fuels.  Hubbert developed a mathematical equation that correlated with observed fossil fuel production data.   The key inputs to his analysis include an estimate of proven reserves and several actual production data points.

Based on his analysis, Hubbert calculated that oil production in the lower forty-eight (the contiguous United States) would peak in either the late sixties or the early seventies.  And you know what?  Oil production in the lower forty-eight actually did peak in 1971, as shown in the chart below.


The graph above shows oil production peaking in 1970.  Since that time, domestic oil production has dropped by close to 50%, even with the advent of two intervening periods of oil price spikes, and multiple administrations and initiatives to secure America's future and eliminate our dependance on foreign sources of oil.  We now depend on foreign sources for approximately two-thirds of our oil, and the amount continues to climb.  


World oil production, above, has been flat for a few years, hitting its peak in 2005 and declining in each of the last two years.  Hubbert predicted global oil production would peak in 2000.  Oil is entering a new phase, and we are facing a global challenge unprecedented in its scale.  What's next?  


Saturday, September 6, 2008

Increasing Global Security Challenges for the US

In New England, we spend approximately $45 billion per year to import energy into our region.  In recent years, this amount has increased significantly, pulling even more economic resources away from other uses.  Our dependence on a depleting resources brought in from other regions and from around the world places an extraordinary burden on our economy and our citizens.  Our economy has benefited to an extraordinary degree from easy access to inexpensive energy over the past one hundred years.   In fact, during most of that period, from the 1920s until 1973, energy prices were steadily decreasing, due to increasing economies of exploration, production, refining and distribution.  

In 1971, with regards to oil, the game started changing with the advent of peak production of oil in the lower 48.  Secondly, in 1973 OPEC realized that they held sway over international markets, and instituted an oil embargo to punish the United States for their support of Israel in the Yom Kippur war.  Overnight, oil prices went up approximately 70%, and the United States was facing physical shortages of oil, requiring rationing.  In 1950, the United States was slf sufficient in terms of energy.  By 1973, the United States was importing approximately 35% of its oil from abroad. 

As a result of the oil embargo, in addition to the economic penalty associated with a significant price rise, the United States was forced into an economic recession.  I recall hearing one person apparently purchased their own gas station to ensure access.  The impact on the American psyche was extraordinary and remains a core element behind our country's global policies regarding maintaining physical access to oil fields, pipelines, refineries and distribution facilities around the world.  In the seventies, the lesson learned by the United States was that our very way of life was somehow not in our hands anymore, was placed in jeopardy and was fundamentally threatened.  In the absence of alternatives, it would almost seem reasonable to build, own and operate a network of 850 military bases around the world, as the remaining superpower, to secure access to oil, the life blood of our economy, at any cost.

Fundamentally, oil is a global resource that has been central to our phenomenal prosperity, but it is now a resource that is increasingly being concentrated in the hands of counties less aligned to the needs and interests of the United States.  The oil majors are  loosing out as many OPEC countries with unelected leaders are controlling all aspects of the oil process.   When coupled with declining  reserves outside of OPEC, this leaves the American and European oil companies with declining world influence and declining access to sufficient reserves to counterbalance their predicament.  ExxonMobil, for example, reported that their oil production declined 8% between 2006 and 2007.  These forces point to declining security of our oil lifelines, reduced influenced in the world, and, when coupled with increasing demand from China and India, points to a more constrained oil market, less direct influence for the United States, and a need to greater military resources being deployed over time to secure access to the oil fields around the world.  This does not paint such a great picture for our future.  

The End of Fire

The end of fire refers to our transition to a post carbon world, a world where energy is not combusted or burned in the traditional sense - hence the end of fire.  It refers as well to the human epoch beginning with human kind's ability to make, apply and control fires to the present time.  We no longer have the luxury of merely combusting fuels to derive thermal energy, but need to move beyond combustion to a more efficient and lower carbon intensive society.   This transition is not only necessary from an environmental perspective, as our environmental devastation is impacting the very means and basis of our survival, when considering the entire human family around the planet.  

The transition to a post carbon world also speaks to a much broader and more significant transition, a transition in how our human species structures our institutions and our perspectives on the basis for life and our relationship to the planet.  This more significant transformation, seen in other cultures across the window of time, speaks to the integrative nature between ourselves and our life sustaining environment.  It is necessary for us to view ourselves as fully integrated participants in natural cycles, not as separate opportunists, scavenging what we can to our own advantage.