Each recession in the last forty years in the United States was presaged by a sharp run-up in oil prices, seen in the chart below. Sustained high oil prices also hold the economy back, which we are experiencing now as in the early 1980s.
High energy prices have effects that ripple through our economy, extracting cash from household incomes and corporate profits. In years past, the United States much more significant market power in oil markets compared to today. When oil prices shot up in the late seventies, the United States reduced demand by switching to more efficient automobiles (Toyotas and Hondas significantly increased market share during this time - that's another issue), shut down oil fired power plants, and improved home and business energy efficiency.
As a result, oil consumption in the United States fell by 16.8% between 1978 and 1983. This drop in United States demand had an impact in tempering global demand for oil, reducing the prices that oil companies and exporting countries could charge. It also helped that OPEC countries were all competing to sell more oil, and that European countries also reduced their oil consumption in similar proportion to the United States. This led to a world awash in oil, leading to lower energy prices, giving the economy a boost to recover in President Reagan's second term.
Currently, the United States is consuming approximately 10.2% less oil in 2012 compared to the country's peak oil consumption in 2005, according to data from the United States Energy Information Agency. Unfortunately, the high prices that the world has been experiencing for several years, appear to be new oil price plateaus. Global demand is very high for oil, with supplies tight. The United States is going to have a very difficult time influencing the supply and demand balance going forward. This circumstance is unfortunate for our economy, as we are continuing to experience the slowest economic recovery since the great depression.
In addition to high oil prices, there are other economic factors tat are holding our economy back. One is the de-leveraging of household and commercial debt. Second is a housing market retrenchment that we are just now coming out of. For more on the hosing market turnaround, see my earlier post here. Third is a business climate that is not seeing a lot of demand, and is favoring cash over capacity additions and hiring.
In the United States, people are making economic decisions in response to high oil prices. As explained in an earlier post on transportation, the United States hit peak oil consumption in 2005, and we are now consuming oil at a level that is approximately 10.2% below our historic peak. This has been accomplished principally by driving fewer miles, and driving more efficient vehicles.
Without oil and natural gas fracking, we would be in a recession, referred to as a double dip. Although natural gas prices have increased 65% in the past year, as seen in my natural gas post here, there still remain near historic lows. Without the significant cost reduction in natural gas, I believe very strongly that we would very likely be back in a recessionary economy.
Going forward, the stars are aligning to keep the economy moving forward, perhaps even at an accelerating pace. These include continued relatively strong job growth in the past 6 months, a surge in new housing starts and a strengthening market for existing homes, extremely favorable natural gas prices, a stock market that continues to perform at market peaks, continued low interest rates and further injections of capital into the market by the United States Federal Reserve.
All is not blue sky and sunny, as fundamental factors impeding long term economic growth will continue to exert significant headwinds on our economy going forward.
Showing posts with label #carbon. Show all posts
Thursday, March 28, 2013
Thursday, March 21, 2013
Waxman/Whitehouse Carbon Tax Draft
Bicameral Committee introduced draft legislation for a carbon tax. Below are links to the four key documents and the text of the summary one pager of the draft legislation.
Representative Henry A. Waxman, Senator Sheldon Whitehouse, Representative Earl Blumenauer, and Senator Brian Schatz released draft carbon-pricing legislation and solicited feedback on it from stakeholders and the public. The legislation would establish the polluter pays principle for dangerous carbon pollution, requiring large emitters to pay for the pollution they emit.
The “discussion draft” contains a new and straightforward approach to putting a price on carbon pollution. The nation’s largest polluters would have to pay a fee for each ton of pollution they release. The legislation assigns responsibility for the assessment and collection of the carbon fees based upon the expertise that has already been developed by EPA and the Treasury Department. Under the discussion draft, EPA’s database of reported emissions would determine the amount of pollution subject to the fee. The Treasury Department would be responsible for the collection and handling of the fees.
The legislators are specifically requesting feedback on the following questions:
Comments can be submitted by email to cutcarbon@mail.house.gov, with responses being accepted up to April 12, 2013.
Below please find the text of the one-pager summary:
Representative Henry A. Waxman, Senator Sheldon Whitehouse, Representative Earl Blumenauer, and Senator Brian Schatz released draft carbon-pricing legislation and solicited feedback on it from stakeholders and the public. The legislation would establish the polluter pays principle for dangerous carbon pollution, requiring large emitters to pay for the pollution they emit.
The “discussion draft” contains a new and straightforward approach to putting a price on carbon pollution. The nation’s largest polluters would have to pay a fee for each ton of pollution they release. The legislation assigns responsibility for the assessment and collection of the carbon fees based upon the expertise that has already been developed by EPA and the Treasury Department. Under the discussion draft, EPA’s database of reported emissions would determine the amount of pollution subject to the fee. The Treasury Department would be responsible for the collection and handling of the fees.
The legislators are specifically requesting feedback on the following questions:
- What is the appropriate price per ton for polluters to pay? The draft contains alternative prices of $15, $25, and $35 per ton for discussion purposes.
- How much should the price per ton increase on an annual basis? The draft contains a range of increases from 2% to 8% per year for discussion purposes.
- What are the best ways to return the revenue to the American people? The discussion draft proposes putting the revenue toward the following goals, and solicits comments on how to best accomplish each: (1) mitigating energy costs for consumers, especially low-income consumers; (2) reducing the Federal deficit; (3) protecting jobs of workers at trade-vulnerable, energy intensive industries; (4) reducing the tax liability for individuals and businesses; and (5) investing in other activities to reduce carbon pollution and its effects.
- How should the carbon fee program interact with state programs that address carbon pollution?
Comments can be submitted by email to cutcarbon@mail.house.gov, with responses being accepted up to April 12, 2013.
- One Pager: "Tackling Climate Change and Raising Revenue for the American People, Carbon Pollution Fee Discussion Draft" (March 12, 2013).
- Section-by-Section: "Discussion Draft: Fee for Emissions of Carbon Pollution" (March 12, 2013).
- Backgrounder: "Carbon Pollution Fees: A New Workable Approach" (March 12, 2013).
- Bill Text: Discussion Draft of Carbon Pollution Fee (March 12, 2013).
Below please find the text of the one-pager summary:
Tackling Climate Change and Raising Revenue for the
American People
Carbon Pollution Fee Discussion Draft
Carbon
pollution from human activity is driving climate change, which is harming our
economy, health, and environment. The United States is the second-largest
source of annual carbon pollution and has contributed over one-quarter of the
cumulative global carbon pollution from human activity. Scientists warn that we
must act now to reduce carbon pollution to avoid potentially catastrophic
consequences.
The
carbon pollution fee program outlined in this discussion draft released by
Congressman Waxman (D-CA), Senator Whitehouse (D-RI), Congressman Blumenauer
(D-OR), and Senator Schatz (D-HI) will generate substantial revenue while
reducing carbon pollution. The draft abides by the following principles:
•
Polluting
industries should be responsible for the harm they are causing to the American
people.
•
All revenue
generated by the carbon pollution fee should be returned to the American
people.
•
Trade-vulnerable,
energy-intensive industries should be protected.
Specifically,
the discussion draft outlines a legislative framework that would:
•
Establish a
carbon pollution fee that applies to all six categories of greenhouse gases.
•
Require large
carbon pollution sources to pay the fee for carbon pollution permits based on
the quantities of carbon pollution reported by the sources under the EPA’s
Greenhouse Gas Reporting Rule.
•
Create a program
to be jointly administered by the Department of the Treasury and EPA. EPA would
implement and enforce emissions reporting under EPA’s Greenhouse Gas Reporting
Rule, and Treasury would assess, collect, and enforce the fee requirements at
the point where carbon pollution is emitted or passed on to consumers,
depending on the type of source.
This
approach would:
•
Drive significant
carbon pollution reductions.
•
Generate
substantial revenue to be returned to the American people.
•
Provide broad
coverage of greenhouse gas emissions, while minimizing compliance and
administrative burdens and utilizing each agency’s area of expertise.
Comments
on any aspect of the discussion draft are welcome, and the lawmakers have
identified the following key questions for feedback:
1.
What is the
appropriate price per ton for polluters to pay? The draft contains alternative
prices of $15, $25, and $35 per ton for discussion purposes.
2.
How much should
the price per ton increase on an annual basis? The draft contains a range of
increases from 2% to 8% per year for discussion purposes.
3.
What are the best
ways to return the revenue to the American people? The discussion draft proposes
putting the revenue toward the following goals, and solicits comments on how to
best accomplish each: (1) mitigating energy costs for consumers, especially
low-income consumers; (2) reduce the federal deficit; (3) protect the jobs of
workers at trade-vulnerable, energy intensive industries; (4) reduce the tax
liability for individuals and businesses; and (5) invest in other activities to
reduce carbon pollution and its impacts.
4.
How should the
carbon fee program interact with state programs that address carbon pollution?
Monday, March 18, 2013
United States Solar Market Grows by Leaps and Bounds
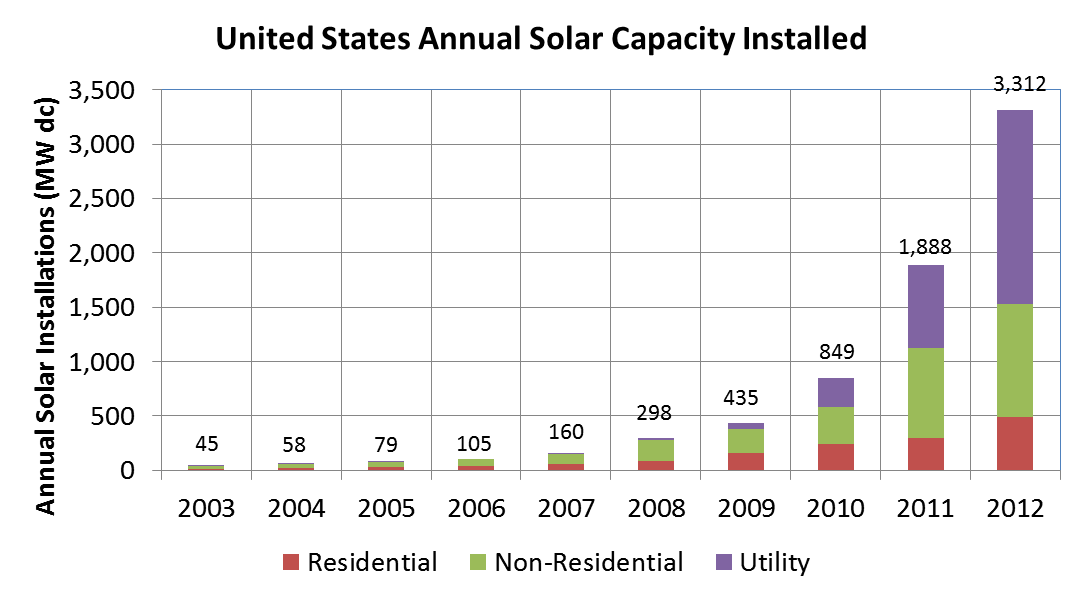
The United States solar market galloped ahead in 2012, growing 75% year-over-year, increasing by 1,424 MW over 2011. The greatest growth occurred in utility scale projects, increasing by 1,021 GW, representing a 124% annual growth.

The cost of designing, procuring and installing solar PV systems continues its steep decline, with the blended average system price dropping a phenomenal 52% in the past three years. These continued precipitous drop in solar costs is a boon to the medium to long term economic viability of solar. In certain markets and applications around the world, solar PV is becoming competitive with grid power. The most competitive applications are grid scale PV installations where installation costs are approaching $2 per watt all in. Certain markets around the world also represent attractive markets due to high extant electricity costs from the grid coupled with high solar insolation.
There is some talk in the industry that solar panels in China are heading to 45 cents per watt. It is also understood that there may be some panel price firming taking place in India, and, at current panel prices, certain solar companies around the world, especially in China where there is a significant over-build in manufacturing capacity, some companies may fail or take on local subsidies to survive.
Deutsche Bank recently released an analysis of global PV markets from the perspective of locations where grid parity will be reached within the next few years. Grid parity may alread have been reached in India, Southern Italy and Spain, where solar developers are proposing projects without requiring subsidies.
When solar crosses the grid parity threshold, solar becomes ever more competitive with existing sources of power generation. One of the surprising market dynamics that is being seen in Germany and Texas, is the basis for economic dispatch of power plants being determined by marginal cost to produce the next electron. Because solar and wind have no fuel costs, this means that are beginning to crowd out fuel-based generating supply.
Once the grid parity threshold is crossed, the adoption of renewables will accelerate, constrained only by capital formation and grid interconnections.
There is another dynamic associated with the economics of wide spread adoptions of solar PV on the grid - long term economics. Germany has made significant use of feed in tariffs to financially support PV systems. In the short term, these feed in tariffs exert a large financial burden on the electric utility companies and their ratepayers. Once, however, the FIT payment schedules reach the end of their payment schedule, the utiltiies will no longer have to subsidize the solar systems, with the result being free power. At that point, depending on the ultimate penetration of zero fuel renewable resources, primarily wind and solar, the utilities will have a cost structure focused on grid capitalization and management, and managing generation and storage resources focused on maintaining grid stability and safe reliable power distribution.

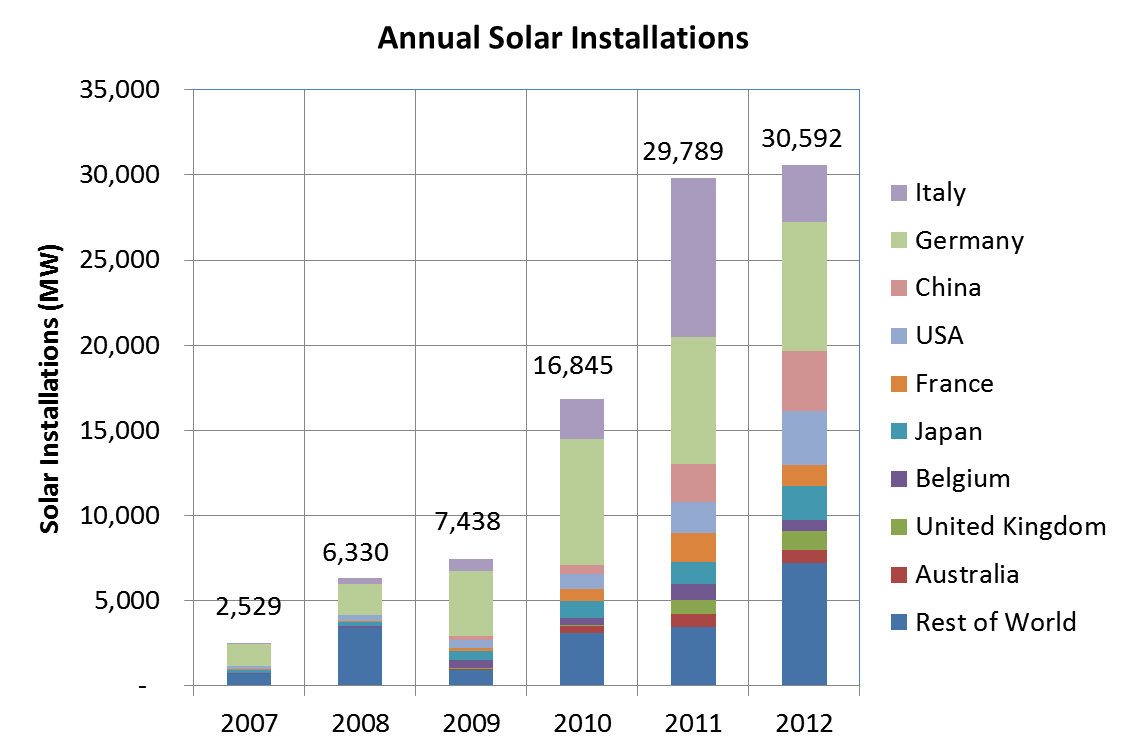
The global market for solar PV has quadrupled in the past three years, increasing from 7,438 MW of installed capacity in 2009, to over 30,000 MW of an estimated installed capacity in 2012, 400% growth. The annual growth of the global PV market appears to have leveled off between 2011 and 2012.
What is also apparent in the global data is the unevenness of year to year deployment in certain countries. The pace of deployment in Germany, for example has leveled off over the past three years. Italy experienced considerable growth in 2011, and has suffered a significant pull back in deployments in 2012, along with France and Spain.
Other countries, such as the United States, China and Japan, are currently seeing significant growth in their solar PV markets.

Sources:

The cost of designing, procuring and installing solar PV systems continues its steep decline, with the blended average system price dropping a phenomenal 52% in the past three years. These continued precipitous drop in solar costs is a boon to the medium to long term economic viability of solar. In certain markets and applications around the world, solar PV is becoming competitive with grid power. The most competitive applications are grid scale PV installations where installation costs are approaching $2 per watt all in. Certain markets around the world also represent attractive markets due to high extant electricity costs from the grid coupled with high solar insolation.
There is some talk in the industry that solar panels in China are heading to 45 cents per watt. It is also understood that there may be some panel price firming taking place in India, and, at current panel prices, certain solar companies around the world, especially in China where there is a significant over-build in manufacturing capacity, some companies may fail or take on local subsidies to survive.
Deutsche Bank recently released an analysis of global PV markets from the perspective of locations where grid parity will be reached within the next few years. Grid parity may alread have been reached in India, Southern Italy and Spain, where solar developers are proposing projects without requiring subsidies.
When solar crosses the grid parity threshold, solar becomes ever more competitive with existing sources of power generation. One of the surprising market dynamics that is being seen in Germany and Texas, is the basis for economic dispatch of power plants being determined by marginal cost to produce the next electron. Because solar and wind have no fuel costs, this means that are beginning to crowd out fuel-based generating supply.
Once the grid parity threshold is crossed, the adoption of renewables will accelerate, constrained only by capital formation and grid interconnections.
There is another dynamic associated with the economics of wide spread adoptions of solar PV on the grid - long term economics. Germany has made significant use of feed in tariffs to financially support PV systems. In the short term, these feed in tariffs exert a large financial burden on the electric utility companies and their ratepayers. Once, however, the FIT payment schedules reach the end of their payment schedule, the utiltiies will no longer have to subsidize the solar systems, with the result being free power. At that point, depending on the ultimate penetration of zero fuel renewable resources, primarily wind and solar, the utilities will have a cost structure focused on grid capitalization and management, and managing generation and storage resources focused on maintaining grid stability and safe reliable power distribution.

The global market for solar PV has quadrupled in the past three years, increasing from 7,438 MW of installed capacity in 2009, to over 30,000 MW of an estimated installed capacity in 2012, 400% growth. The annual growth of the global PV market appears to have leveled off between 2011 and 2012.
What is also apparent in the global data is the unevenness of year to year deployment in certain countries. The pace of deployment in Germany, for example has leveled off over the past three years. Italy experienced considerable growth in 2011, and has suffered a significant pull back in deployments in 2012, along with France and Spain.
Other countries, such as the United States, China and Japan, are currently seeing significant growth in their solar PV markets.

Sources:
Subscribe to:
Posts (Atom)