Showing posts with label global warming. Show all posts

Thursday, March 21, 2013

Waxman/Whitehouse Carbon Tax Draft

Bicameral Committee introduced draft legislation for a carbon tax.  Below are links to the four key documents and the text of the summary one pager of the draft legislation.

Representative Henry A. Waxman, Senator Sheldon Whitehouse, Representative Earl Blumenauer, and Senator Brian Schatz released draft carbon-pricing legislation and solicited feedback on it from stakeholders and the public.  The legislation would establish the polluter pays principle for dangerous carbon pollution, requiring large emitters to pay for the pollution they emit.

The “discussion draft” contains a new and straightforward approach to putting a price on carbon pollution.  The nation’s largest polluters would have to pay a fee for each ton of pollution they release.  The legislation assigns responsibility for the assessment and collection of the carbon fees based upon the expertise that has already been developed by EPA and the Treasury Department.  Under the discussion draft, EPA’s database of reported emissions would determine the amount of pollution subject to the fee.  The Treasury Department would be responsible for the collection and handling of the fees.


The legislators are specifically requesting feedback on the following questions:

  1. What is the appropriate price per ton for polluters to pay?  The draft contains alternative prices of $15, $25, and $35 per ton for discussion purposes.
  2. How much should the price per ton increase on an annual basis?  The draft contains a range of increases from 2% to 8% per year for discussion purposes.
  3. What are the best ways to return the revenue to the American people?  The discussion draft proposes putting the revenue toward the following goals, and solicits comments on how to best accomplish each:  (1) mitigating energy costs for consumers, especially low-income consumers; (2) reducing the Federal deficit; (3) protecting jobs of workers at trade-vulnerable, energy intensive industries; (4) reducing the tax liability for individuals and businesses; and (5) investing in other activities to reduce carbon pollution and its effects.
  4. How should the carbon fee program interact with state programs that address carbon pollution?

Comments can be submitted by email to cutcarbon@mail.house.gov, with responses being accepted up to April 12, 2013.


  1. One Pager: "Tackling Climate Change and Raising Revenue for the American People, Carbon Pollution Fee Discussion Draft" (March 12, 2013).
  2. Section-by-Section: "Discussion Draft: Fee for Emissions of Carbon Pollution" (March 12, 2013).
  3. Backgrounder: "Carbon Pollution Fees: A New Workable Approach" (March 12, 2013).
  4. Bill Text: Discussion Draft of Carbon Pollution Fee (March 12, 2013).

Below please find the text of the one-pager summary:


Tackling Climate Change and Raising Revenue for the American People
Carbon Pollution Fee Discussion Draft

Carbon pollution from human activity is driving climate change, which is harming our economy, health, and environment. The United States is the second-largest source of annual carbon pollution and has contributed over one-quarter of the cumulative global carbon pollution from human activity. Scientists warn that we must act now to reduce carbon pollution to avoid potentially catastrophic consequences.
The carbon pollution fee program outlined in this discussion draft released by Congressman Waxman (D-CA), Senator Whitehouse (D-RI), Congressman Blumenauer (D-OR), and Senator Schatz (D-HI) will generate substantial revenue while reducing carbon pollution. The draft abides by the following principles:
          Polluting industries should be responsible for the harm they are causing to the American people.
          All revenue generated by the carbon pollution fee should be returned to the American people.
          Trade-vulnerable, energy-intensive industries should be protected.
Specifically, the discussion draft outlines a legislative framework that would:
          Establish a carbon pollution fee that applies to all six categories of greenhouse gases.
          Require large carbon pollution sources to pay the fee for carbon pollution permits based on the quantities of carbon pollution reported by the sources under the EPA’s Greenhouse Gas Reporting Rule.
          Create a program to be jointly administered by the Department of the Treasury and EPA. EPA would implement and enforce emissions reporting under EPA’s Greenhouse Gas Reporting Rule, and Treasury would assess, collect, and enforce the fee requirements at the point where carbon pollution is emitted or passed on to consumers, depending on the type of source.
This approach would:
          Drive significant carbon pollution reductions.
          Generate substantial revenue to be returned to the American people.
          Provide broad coverage of greenhouse gas emissions, while minimizing compliance and administrative burdens and utilizing each agency’s area of expertise.
Comments on any aspect of the discussion draft are welcome, and the lawmakers have identified the following key questions for feedback:
1.      What is the appropriate price per ton for polluters to pay? The draft contains alternative prices of $15, $25, and $35 per ton for discussion purposes.
2.      How much should the price per ton increase on an annual basis? The draft contains a range of increases from 2% to 8% per year for discussion purposes.
3.      What are the best ways to return the revenue to the American people? The discussion draft proposes putting the revenue toward the following goals, and solicits comments on how to best accomplish each: (1) mitigating energy costs for consumers, especially low-income consumers; (2) reduce the federal deficit; (3) protect the jobs of workers at trade-vulnerable, energy intensive industries; (4) reduce the tax liability for individuals and businesses; and (5) invest in other activities to reduce carbon pollution and its impacts.
4.      How should the carbon fee program interact with state programs that address carbon pollution?
Monday, March 18, 2013

United States Solar Market Grows by Leaps and Bounds

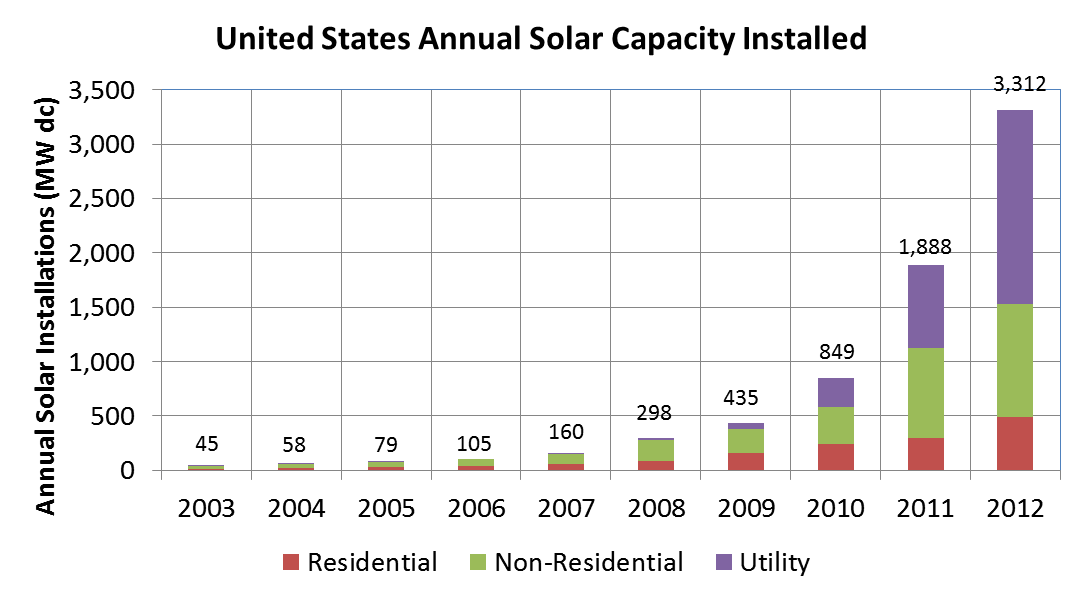
The United States solar market galloped ahead in 2012, growing 75% year-over-year, increasing by 1,424 MW over 2011.  The greatest growth occurred in utility scale projects, increasing by 1,021 GW, representing a 124% annual growth.


The cost of designing, procuring and installing solar PV systems continues its steep decline, with the blended average system price dropping a phenomenal 52% in the past three years.  These continued precipitous drop in solar costs is a boon to the medium to long term economic viability of solar.  In certain markets and applications around the world, solar PV is becoming competitive with grid power.  The most competitive applications are grid scale PV installations where installation costs are approaching $2 per watt all in.  Certain markets around the world also represent attractive markets due to high extant electricity costs from the grid coupled with high solar insolation.

There is some talk in the industry that solar panels in China are heading to 45 cents per watt.  It is also understood that there may be some panel price firming taking place in India, and, at current panel prices, certain solar companies around the world, especially in China where there is a significant over-build in manufacturing capacity, some companies may fail or take on local subsidies to survive.

Deutsche Bank recently released an analysis of global PV markets from the perspective of locations where grid parity will be reached within the next few years.  Grid parity may alread have been reached in India, Southern Italy and Spain, where solar developers are proposing projects without requiring subsidies.

When solar crosses the grid parity threshold, solar becomes ever more competitive with existing sources of power generation.  One of the surprising market dynamics that is being seen in Germany and Texas, is the basis for economic dispatch of power plants being determined by marginal cost to produce the next electron.   Because solar and wind have no fuel costs, this means that are beginning to crowd out fuel-based generating supply.

Once the grid parity threshold is crossed, the adoption of renewables will accelerate, constrained only by capital formation and grid interconnections.

There is another dynamic associated with the economics of wide spread adoptions of solar PV on the grid - long term economics.  Germany has made significant use of feed in tariffs to financially support PV systems.  In the short term, these feed in tariffs exert a large financial  burden on the electric utility companies and their ratepayers.  Once, however, the FIT payment schedules reach the end of their payment schedule, the utiltiies will no longer have to subsidize the solar systems, with the result being free power.  At that point, depending on the ultimate penetration of zero fuel renewable resources, primarily wind and solar, the utilities will have a cost structure focused on grid capitalization and management, and managing generation and storage resources focused on maintaining grid stability and safe reliable power distribution.


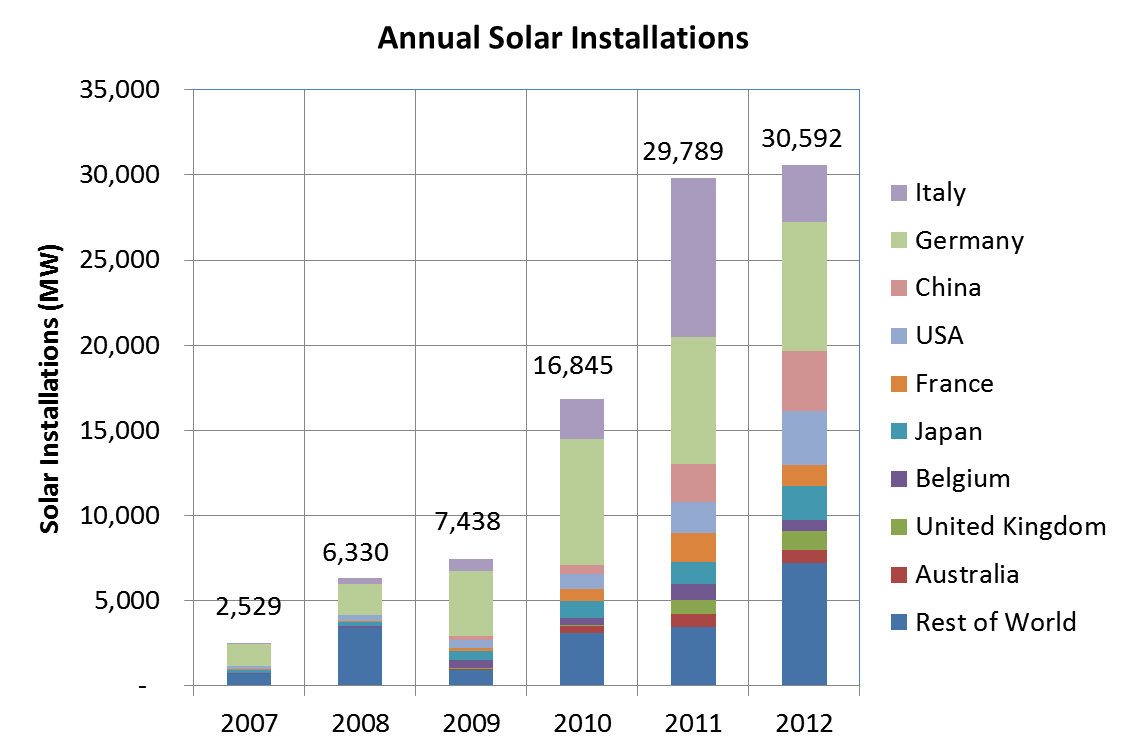
The global market for solar PV has quadrupled in the past three years, increasing from 7,438 MW of installed capacity in 2009, to over 30,000 MW of an estimated installed capacity in 2012, 400% growth.  The annual growth of the global PV market appears to have leveled off between 2011 and 2012.

What is also apparent in the global data is the unevenness of year to year deployment in certain countries.  The pace of deployment in Germany, for example has leveled off over the past three years.  Italy experienced considerable growth in 2011, and has suffered a significant pull back in deployments in 2012, along with France and Spain.

Other countries, such as the United States, China and Japan, are currently seeing significant growth in their solar PV markets.


Sources:

  1. Solar Energy Industry Association
  2. European Photovoltaic Industry Association
  3. Deutsche Bank


Saturday, January 2, 2010

Glacial Melting Threatening Populations Around the Globe

Glaciers around the world are disappearing on an accelerated basis, disrupting water flows upon which humans have depended for thousands of years. These climate driven changes are creating water shortages for entire populations, forcing governments to consider mass migrations in the interest of survival. In most cases, these aggressive reductions in water availability are occurring in places where the resources just do not exist to put adequate alternatives in place in time.

One place where this is occurring is Bolivia, where the existence of 100 million people in the region is threatened with the complete melting of most of the glaciers in the Andes within the next twenty years (according to the World Bank, as reported in the New York Times, December 14, 2009). In 2009, the Chacaltaya glacier, approximately 30 kilometers from La Paz, Bolivia disappeared. Water for La Paz comes from a cluster of nearby glaciers, which have lost 35 percent of their ice mass since 1983. Accordingly, the loss of Chacaltaya is the canary in the coal mine.

The first water migrations have begun, with people moving from Palca, which is in the mountains near La Paz, to El Alto, a fast growing municipality next to La Paz. Farmers and residents of mountainous villages such as Palca, have already begun to see glacial melt drying up in the summers, when water for their farms is crucial for survival. The next phase of water migrations are expected to drive people out of El Alto, where supply will fall below demand in just a few years, due to the combination of decreasing glacial runoff and increasing demand.

This same scenario is impacting peoples' lives in the Himalayas as well, with Himalayan glaciers having lost 21 percent of their glacial mass since 1962. Approximately 2 billion people in India, China and Pakistan depend on Himalayan glacial melt for irrigation and drinking water. With the first Himalayan glaciers expected to disappear by 2035, eventually significantly curtailing agricultural production, the disruption to millions of people's lives will be significant.

These real and current disruptions to people's lives around the globe, tied to massively disruptive climate change, provide a strong argument for significantly increasing the investment in clean energy technologies, and accelerating the deployment of increased efficiency and renewable energy throughout our economies.


Tuesday, September 9, 2008

The Arctic Ice Cap

The Arctic ice cap is going through a significant transition, represented by the opening of sea lanes around different parts of the polar ice cap, and an overall shrinkage represented by the area of the ice cap.  Many point to the shrinking ice cap as a key leading indicator of the impending devastation associated with the effects of global warming.  The Arctic has caught our imagination, along with the apparent devastating impact the shrinking ice has as the core habitat for polar bears.  What do we know about the Arctic ice situation?  Has it melted before?  What are the implications of the shrinking ice cap on our environment?  Are their longer term implications, or its it a stark harbinger of things to come?

AN excellent source for information about the condition of the Arctic ice cap is the National Snow and Ice Data Center in Boulder, Colorado.  This organization publishes data and images associated with Arctic sea ice on a monthly basis, and has analyzed time series data to ascertain long term tends in addition to the monthly assessments.   

Fundamentally, the arctic ice cap is disappearing.  In the chart below, the average August ice extent was just over 8 million square kilometers, while the average August ice extent in August of this year, 2008, was around 6 million square kilometer, a 25% reduction in ice extent.  The trend corresponds to an average loss of ice in the range of  8.7% reduction per decade.  The prediction is that the sumer ice in the Arctic will completely disappear by about 2030.


Every year, the Arctic sea ice goes through an annual cycle of melting and freezing, reaching its minimum ice level in September.  The lowest level of ice ever recorded took place in September of 2007.  As of September 4, 2008, the amount of ice in the Arctic is above the lowest levels recorded last year but the experts suggest that the daily loss of ice is so high this year, that this year's lowest level may still surpass last year's.  As can e seen in the graph below, the blue line is is getting very close to the dotted line that represents last year's ice extent.  It can also be observed that the amount of ice in September is close to 4 million square kilometers,  which is 50% the average level of ice over the period 1979-2000, suggesting that the complete loss of ice is not outside the realm of possibilities. 
  
The dynamics and implications associated with the melting of the Arctic ice cap are not yet fully understood, although impacts will be felt by animals, additional climate implications and in the political realm.  From the image below, the physical reduction of sea ice can be observed.  One of the implications that has ben mentioned is the impact on polar bears habitat, reducing their habitat and endangering their survival.  With regards to the climate, one of the dynamics is that the ice reflects sunlight back into space.  As the ice disappears, the sunlight that would normally be reflected off the ice is then absorbed by the water, heating up the water.  This is a positive feed back loop in that it accelerates further warming.  The third broad implication is the expanding political positioning around access to the presumed resources in the Arctic ocean.  This political struggle is being pursued by the major countries that ring the pole, namely Canada, Russia and the United States. 


A few final notes.  Because the polar ice cap is floating, its melting will not raise the level of the ocean.  The key source for water that will raise the level of the oceans is the significant amount of freshwater frozen in Greenland.  The ice in Green land is several miles thick, and will have a significantly adverse effect on both the sea level and the dynamics of water flow in the North Atlantic, impacting the Gulf Stream and weather patterns and temperatures for North America and Europe.  Other significant ice melts are occurring in glaciers around the world, further contributing to rising sea levels.  In addition, permafrost around the world is melting, transitioning a great deal of biomass from a frozen state into a non-frozen state.  This biomass will be consumed by microbes that emit methane, further contributing to greenhouse gases and global warming.    

The source for these images, and a great source for additional information, is the National Snow and Ice Data Center, which can be found at the following web address:
http://nsidc.org/index.html


Saturday, September 6, 2008

The End of Fire

The end of fire refers to our transition to a post carbon world, a world where energy is not combusted or burned in the traditional sense - hence the end of fire.  It refers as well to the human epoch beginning with human kind's ability to make, apply and control fires to the present time.  We no longer have the luxury of merely combusting fuels to derive thermal energy, but need to move beyond combustion to a more efficient and lower carbon intensive society.   This transition is not only necessary from an environmental perspective, as our environmental devastation is impacting the very means and basis of our survival, when considering the entire human family around the planet.  

The transition to a post carbon world also speaks to a much broader and more significant transition, a transition in how our human species structures our institutions and our perspectives on the basis for life and our relationship to the planet.  This more significant transformation, seen in other cultures across the window of time, speaks to the integrative nature between ourselves and our life sustaining environment.  It is necessary for us to view ourselves as fully integrated participants in natural cycles, not as separate opportunists, scavenging what we can to our own advantage.