Showing posts with label miles driven. Show all posts

Sunday, March 17, 2013

Tectonic Shift in US Transportation Continued in 2012

Transportation in the United States continued its tectonic shift in 2012, with gasoline sales and miles driven continuing to decline, and model year fleet efficiency continuing to climb.  Never before, over decades of data, have miles driven not returned to their pre-recession levels by this stage in an economic recovery.  These changes generally bode well for the US economy and households, with benefits including:

  • Reduced oil imports; 
  • Favorable impact on international balance of trade;
  • Reduced pressure on the dollar against foreign currencies; and
  • Favorable impact on household finances, with fewer dollars spent on gasoline.
The contrary position is that these changes are a result of significant economic pain across our economy, due to high and prolonged oil prices, that have caused prolonged economic dislocation, evidenced by continued high unemployment, restrained consumer spending and economic growth below expectations and below average.  These observations are evidenced in the data provided below.

Gasoline sales in 2012, seen in the chart below, are at a level not seen since 1997, and are 8% below the peak set in 2005.   


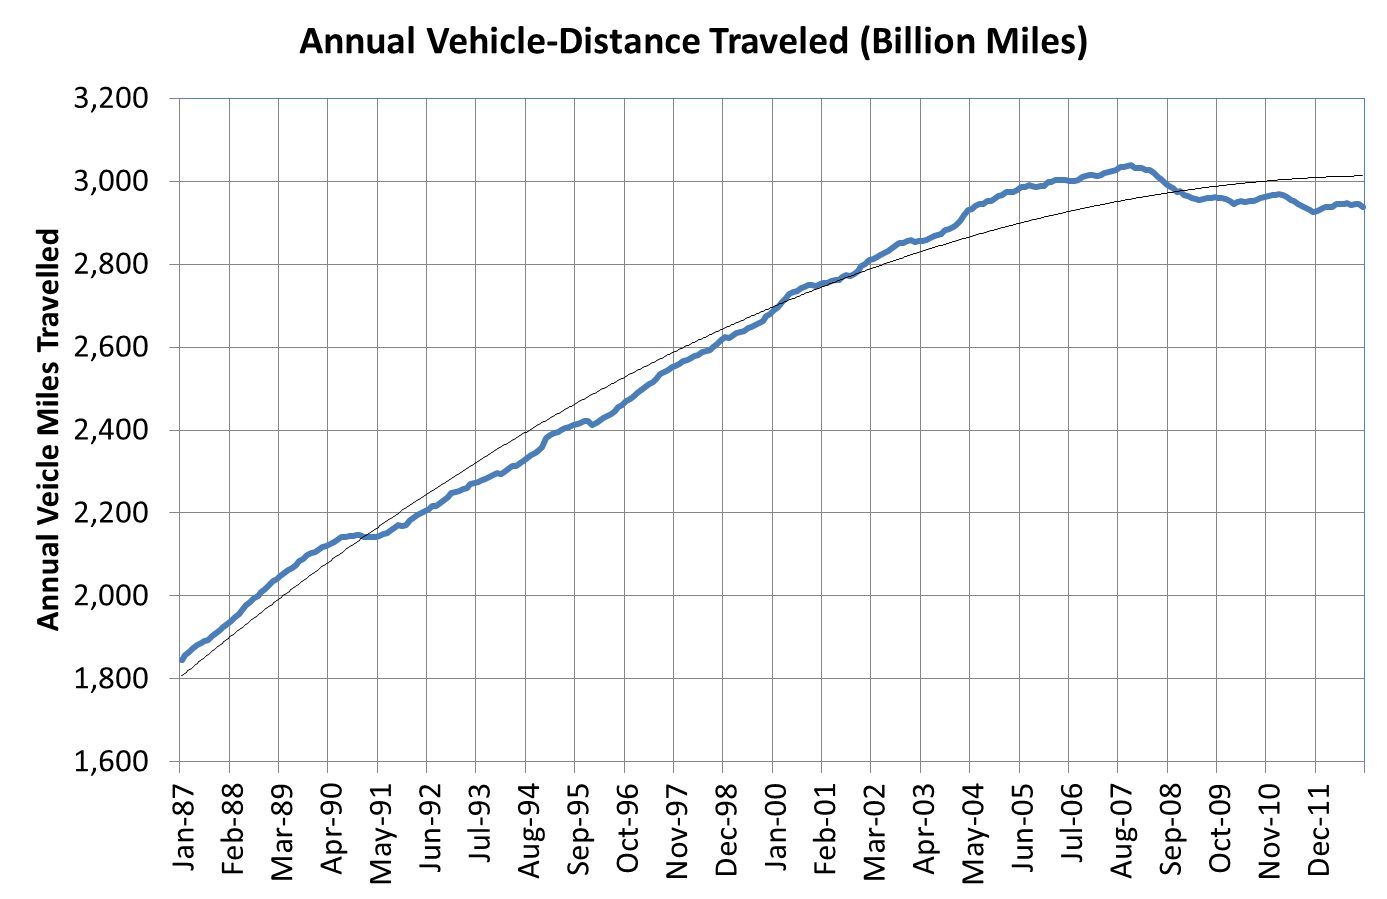
Vehicle miles driven peaked in the United States in 2007, seen in the chart below, at 3,026 billion miles, and, in 2012, was 2,942 billion miles, 2.8% below the 2007 peak.


Model year vehicle efficiency continues to grow, as seen in the chart below, 2012 average miles per gallon of vehicles sold was 23.9 MPG, which is a 14% increase over the vehicles sold in 2008 of 20.9 mpg.


Sources:

  1. United States Energy Information Agency
  2. United States Department of Transportation
  3. United States Environmental Protection Agency


Saturday, September 13, 2008

Creating a Sustainable Transportation Future

Overview
The current transportation system in the United States is not sustainable from an energy, economic,  environmental or global equity perspective.  A wide range of alternatives are being pursued by governments, manufacturers, and consumers to develop meaningful alternatives from plug-hybrids, to ethanol, natural gas and hydrogen.  The use of liquid petroleum dominates the transportation sector due to its astoundingly favorable characteristics - high energy density, easy to transport and use, and reasonably cost effective relative to its utility.  Around the world, the issue of dependance on fossil fuels for transportation is compounded, with high market adoption rates with very little market penetration to date.  

Fundamentally, the position we are in today, with respect to demand frequently outpacing supply, increasingly distorted economic concentration in producing countries, increasing emissions, and increasing prices, will continue to represent the broad trend.  If we think that there is sufficient justification to develop alternative pathways today, the urgency will only increase.  

Energy Use for Transportation
In 2007, 68.3% of our petroleum use in the United States was used for transportation, amounting to 14.12 million barrels per day (mbpd) out of 20.68 mbpd total petroleum consumption in the United States.  Light vehicle consumption, basically the cars and trucks that we all drive, accounts for about 65.2% of the transportation energy consumed, or approximately 9.2 mbpd.  

In the United States, our transportation energy consumption is driven by our choices regarding modes of transportation, the fundamental efficiency of our vehicles, the miles we drive and how we drive with respect to efficiency.  Early in the previous century, the die was cast to facilitate the broad use of automobiles as the dominant mode of transportation in the United States.  Consequently, low oil prices are a cornerstone of the transportation infrastructure that we have developed in the United States.  

When compared to other countries in the world, the United States has some of the lowest oil prices, even considering the recent run up in prices.  Other countries apply high tax rates to  petroleum sales, effectively increasing retail rates significantly.  Based on data from March, 2008, we can see on the following chart that gasoline prices in the United States $3.44 per gallon are still less than half of the gasoline prices when compared to countries in the European Union. 


One of key questions for transportation energy is developing an understanding of switching behavior under conditions of high prices.  One of the facts that people may not remember is the significant reduction of approximately 25% in our national oil consumption over the period from 1978 through 1982.  This significant reduction resulted in a curtailment of national and international demand for oil, reducing oil prices for a prolonged period.  This demand reduction in the late seventies was due to consumers, governments and businesses and utilities instituting new policies and changing buying behaviors and driving habits to reduce oil consumption.     

This year, in 2008, as a result of high oil prices, consumers have been making changes in their purchases and behaviors geared to reducing oil demand, which is having an impact on both aggregate petroleum demand for the United States as well as impacting major United States automobile manufacturers.   In the chart below, from EIA data, we can see that petroleum use for the transportation sector is down year over year, averaging to a 1.4% reduction over the first five months of the year, with May representing a 2.3% reduction on a  year over year basis. 


The short term drop in petroleum consumption in the transportation sector can be attributed to a corresponding drop in vehicle miles driven, as calculated by U.S. Department of Transportation, and presented below.  Based on the first three months of the year, it appears that vehicle miles travelled were reduced by approximately 3.3% on a year of year basis.  


There has also been a marked shift in the types of vehicles that people are purchasing, shifting from trucks and SUVs to small efficient vehicles.

Emission Associated with Transportation
In 2003, transportation accounted for approximately 27% of greenhouse gas emissions in the United States.  As seen in the chart below, transportation is the fastest growing source of emissions in the country.


Each car in the United States, on average, emits about 1 pound of CO2 for each mile driven.  Consequently, if the average person drives 12,000 miles per year, that is equivalent to 12,000 pounds per year, or 6 tons per year.  Multiply this number times 220 million cars in the United States, resulting in approximately 1.3 billion tons per year of CO2 emissions from our cars. 

For the world, we can make some assumptions about the average efficiency (28 mpg) and miles driven (8,000 miles per car) and the number of non-US cars (38 million) which results in 1.2 billion tons of CO2 emissions per year, and a total due to light vehicles in the world of 2.5 trillion tons per year.  The expectation is that the number of vehicles in the world will double in the next 30 years, which would result in emissions of 5 trillion tons o CO2 per year.  If it is assumed that efficiency will improve by 50%,  our global transportation emissions associated with light vehicles will be 3.2 trillion tons per year, a significant increase.   

Transportation is a vexing problem with regards to oil demand and emissions, as the utility of petroleum-based individual transportation is extremely high.  As economies around the world develop, such as China and India, the global demand for vehicles will continue to grow, as will the fundamental demand for petroleum.  

Solutions
The solutions for addressing the economic and emissions issues associated with petroleum-based transportation are many and varied.  There are three fundamental directions - (1)  Improve efficiency of gasoline and diesel-based vehicles; (2) Develop alternative fuel vehicles; and (3) Develop alternative transportation options.  These solutions will be explored in future blogs.