Assessment of the United States Economy
A Review and Assessment
of the Current Strength of the United States Economy and of the Likelihood for
an Economic Downturn Over the Next Five Years based on Evaluating Eleven Key Economic
Performance Indices
January 2017
Brad Bradshaw
President, Velerity
brad@velerity.com
A. Summary - The United States Economy is Strong and will Grow Briskly Through 2017 and Into 2018, At Which Time Growth will Begin to Falter
The United States economy is exhibiting a strength that is
likely to continue through 2017 and into 2018, at which time, absent certain
exogenous factors which can be difficult to predict and may accelerate constraints
on growth, the economy will face increasing headwinds in keeping with the
natural course of the business cycle.
This assessment is based on evaluating the strength and
trends of certain underlying factors which provide a picture of the health and
direction of the economy. There are,
however, also certain other factors which are beginning to push back on the
overall strength of the economy as well, factors which are limited in their
impact at this time, but which will grow over the next two years.
This summary is designed to bring to light these factors and
for readers to draw their own conclusions.
B. Vehicle Miles Driven Continue Strong Growth Trajectory
A strong indicator of economic activity is the total
vehicles miles driven, derived from data published by the United States
Department of Transportation, shown in Figure 1 below. Vehicle miles driven currently surpass the
pre-recession level of about 255 billion miles per month to the current level
of about 270 billion miles. The
trajectory of miles driven shows a decline in the rate of growth just prior to
the 2007 recession. The current
trajectory shows significant relative upward growth, with perhaps a little
softening beginning in July 2015 and extending to the current period. The grey bars in the chart below correspond
to recessions.
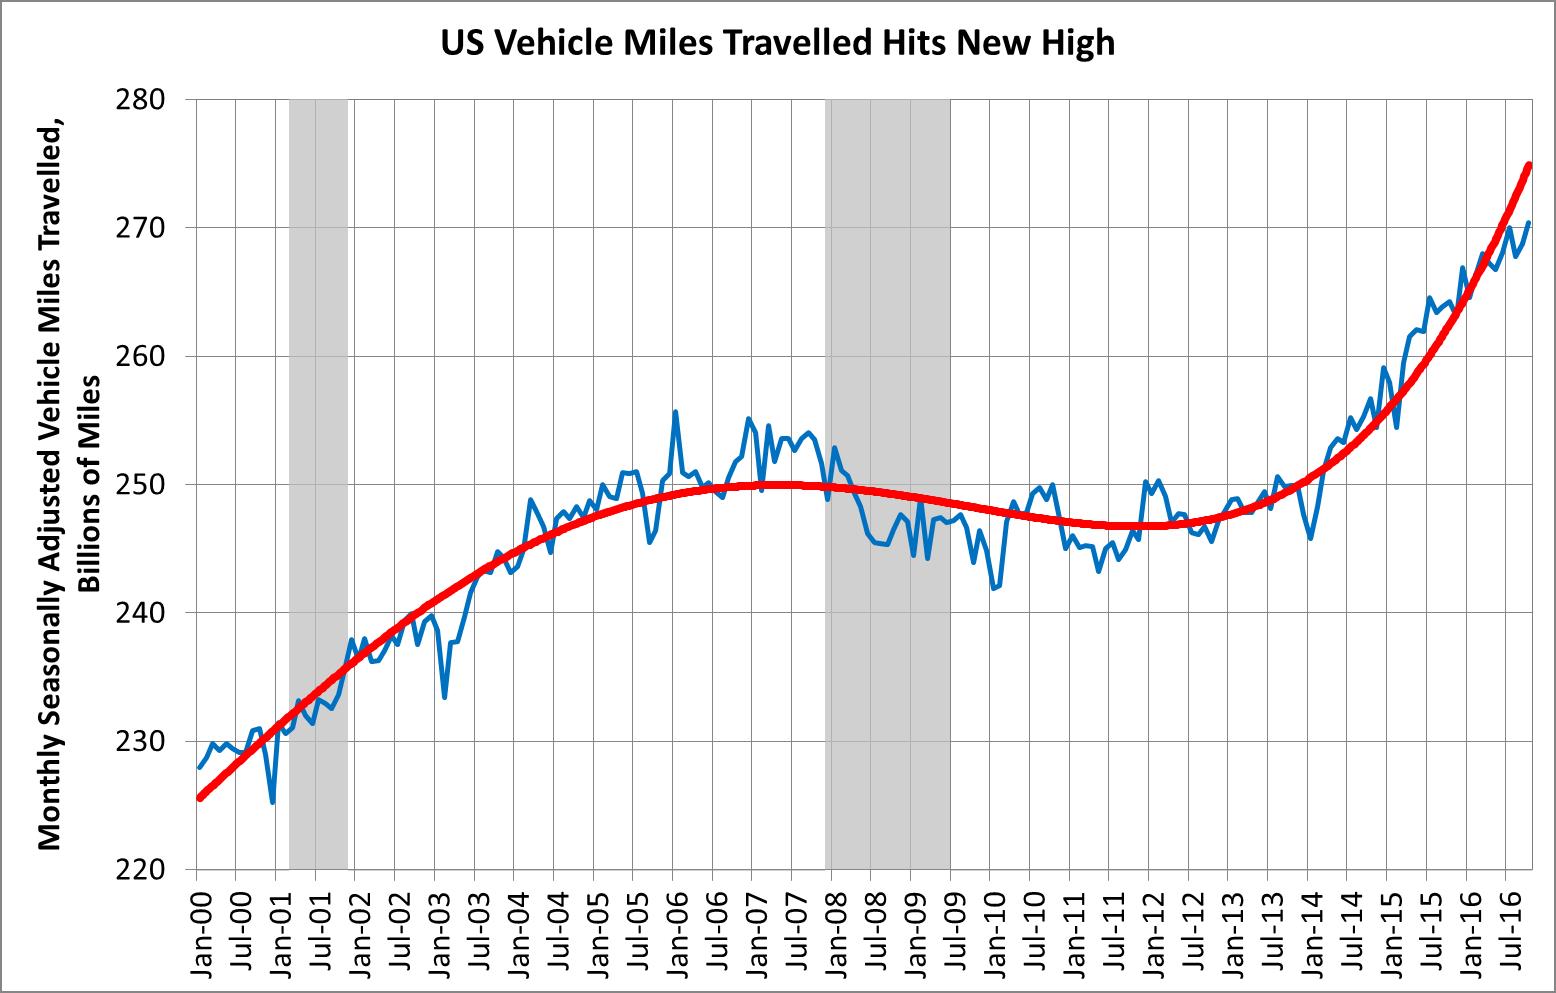
Figure 1 – Vehicle Miles Driven
Going forward, it will be useful to track this factor closely,
to see if the rate of growth continues to decline as it perhaps has in the last
twelve months of data.
C. Total Non-Farm Employment Continues Strong Upward Growth Trajectory
Employment in the United States is a strong indicator
of economic activity, given that consumer expenditures make up approximately two-thirds
of the country’s gross domestic product. Throughout history, the level of economic
activity correlates very well with vehicle miles driven and, over many years,
aggregate energy consumption. Total
non-farm employment, as seen in Figure 2 shown below, exceeds pre-recession
levels, moving from approximately 138 million in 2007 just before the recession,
dropping to approximately 130 million people just after the recession, and
rising to close to 145 million people by the end of 2016.

Figure 2 – Total Non-Farm Employment
The trajectory of total employment was strong as 2016 came
to a close, with no market change in direction or even a hint of an inflection
point. It is important to note that as
total employment continues to rise, and unemployment falls below the economy’s
full employment level, it is likely that there will be increasing pressure on
wages. The feedback on the economy will potentially
be moderate inflation pressures.
Total employment is an important leading indicator relative
to assessing the forward going strength of the economy. Before each recession, the trajectory of
total employment falters, beginning with an inflection point, followed by a
decline in growth rates, a decline in the pitch of the trajectory. There may be a hint of an inflection point in
recent data, giving the current expansion a minimum of one more year, and not
less.
D. Nominal Wages Continue Upward Growth Albeit Exhibiting Zero Inflation-Adjusted Growth Since the Recession
Wage growth in the United States has been tepid since the
2007 recession, growing at half the pre-recession level. Figure 3 below shows continued and steady growth
in nominal wages since 2000. Wages do
not appear to have much sensitivity to aggregate economic activity, which
results in the observation that wage growth in not a strong indicator of
economic activity.
When adjusted for inflation, however, wages exhibit a longer
term and troubling trend, with reduced growth post-recession as compared to the
pre-recession period. The annual growth
rate of inflation adjusted wages prior to the recession, over the period from January
2000 through January 2008 is approximately a 0.87% compound annual growth rate. From the period after the recession, from
July, 2009 through July, 2016, the compound annual growth rate is only about
0.47%. This low growth rate in wages since
2009 belies structural changes in the economy, with labor being crowded out by
more efficient capital and equipment resources as factors of production, and
the loss, for perhaps a range of reasons, of bargaining power of labor across
the economy.
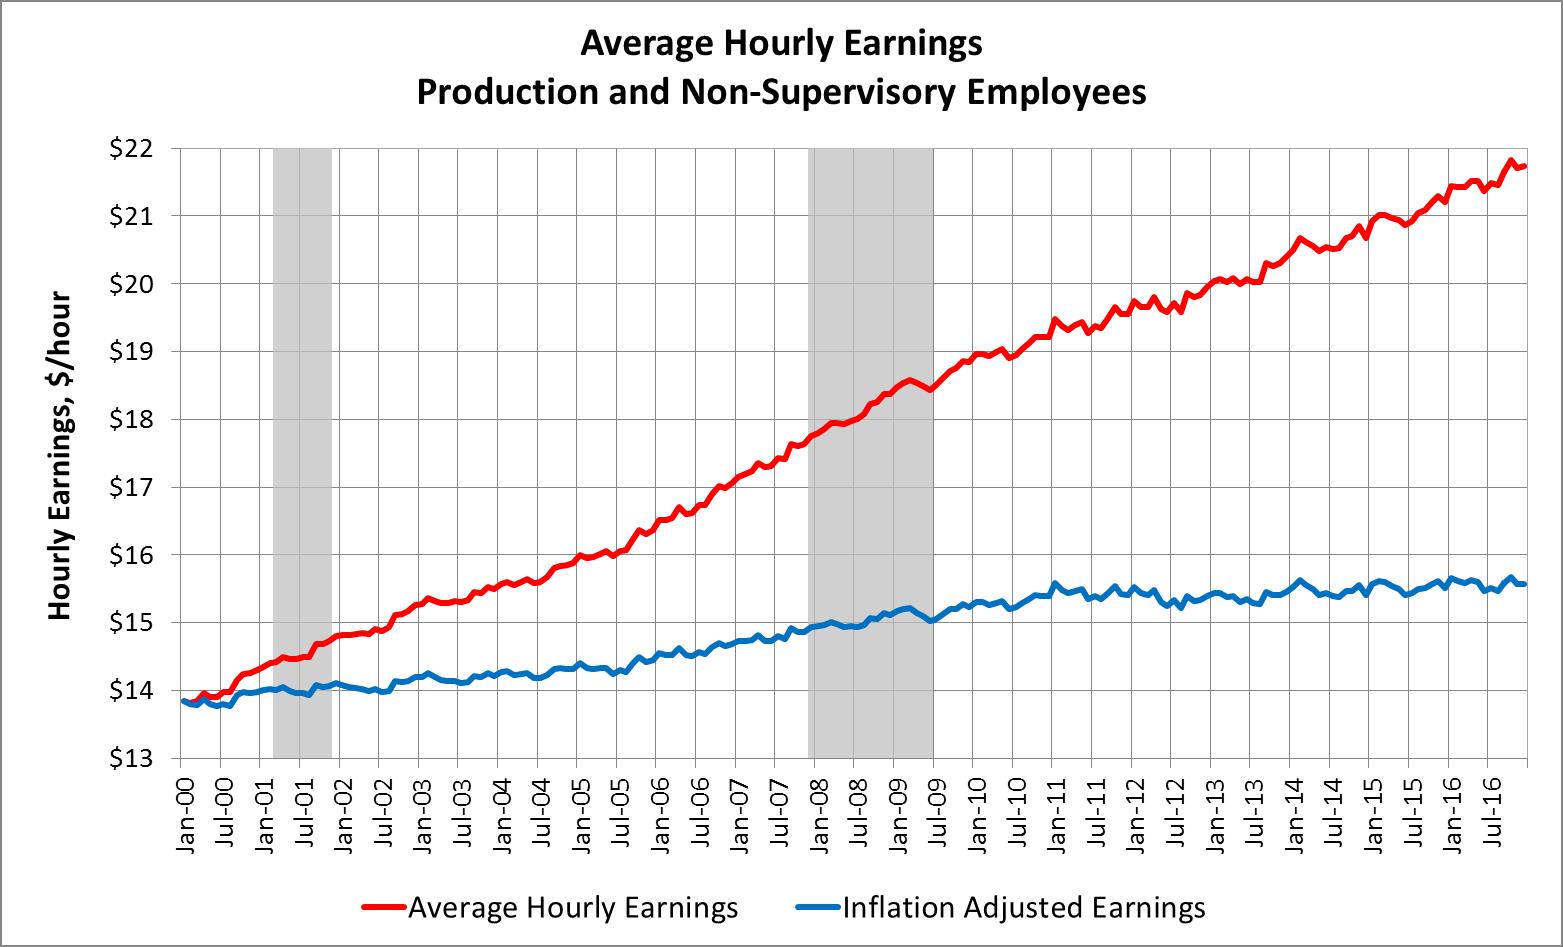
Figure 3 – Average Hourly Earnings
Going forward, it will be instructive to observe the
inflation adjusted the rate of growth in wages.
It appears that an inflation adjusted annual rate of growth above 0.5%
to 0.7% likely indicates or is a pre-requisite for a run-up into an over-heated
economic cycle.
E. Existing Home Sales
Existing home sales, as seen in Figure 4 below, continue upward
growth, moving from about 4.75 million units in August, 2012 to approximately
5.6 million units in November, 2016, representing a compound annual growth rate
of 3.9%. This level of growth is not sustainable in the long term, and would
need to re-evaluated relative to the overall housing stock level.
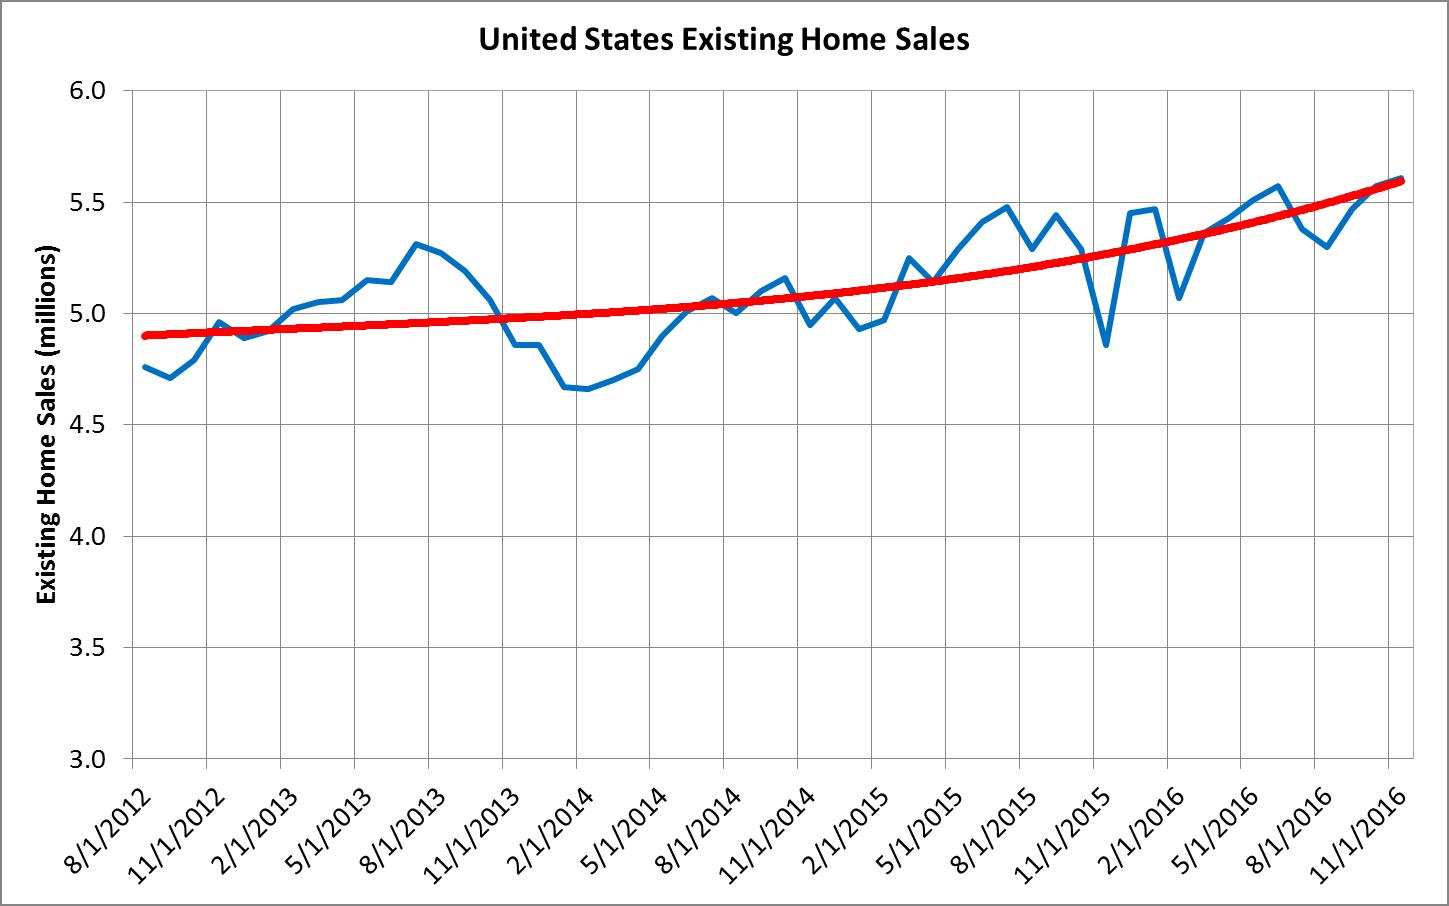
Figure 4 – Existing Home Sales
F. Housing Starts
Housing starts are an important indication of the
health of our economy, illustrating the capacity for existing and prospective
homeowners to invest in their future, entailing commitments of capital and
income that illustrates their own economic well-being and capacity. In Figure 5 below, housing starts peaked two
and one-half years before the 2007 recession, with permits being pulled for
200,000 units in June, 2005.
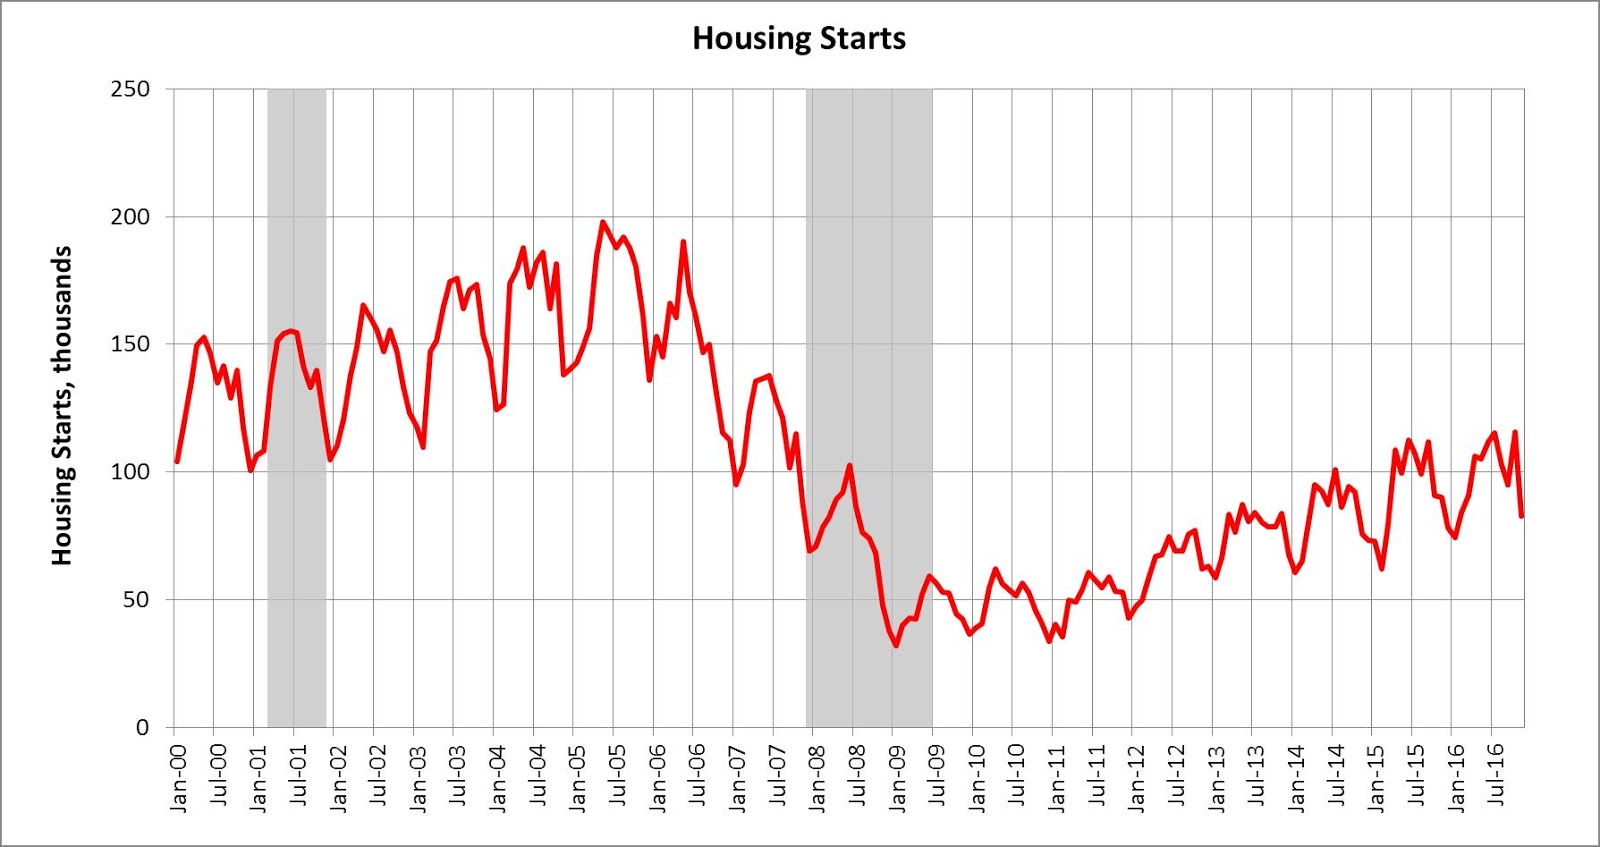
Figure 5 – Housing Starts
The level of new home construction was destroyed by the 2007
recession, dropping 85% from the peak of 200,000 units in June, 2005 to
approximately 30,000 units in January, 2009.
Since the depths of the recession, housing starts have recovered to
approximately half of what they were at the peak.
Housing starts have not fully recovered from the 2007 recession. Housing starts appear to be a strong leading
indicator of a recessionary economy. The
appetite of consumers to purchase new homes is subject to their income and
interest rates. Slowdowns in the economy
begin with constrained personal incomes and rising interest rates, which is
consistent with the validity of housing starts as a good indicator of the strength
of the economy.
There also appears to be a summer peak typically associated
with housing starts. This summer peak
will be an important number to watch going forward, as a year over year drop in
the summer peak provides an strong indication that a pull-back in the economy
may be underway. As it currently appears,
there may be a slight downward shift in the year over year growth rate between
2015 and 2016 which bears close scrutiny going forward.
G. Primary Energy Consumption Trending Moderately Upward
Primary energy consumption correlates very well with long
run economic activity. The consumption
of energy is highly variable on a month to month basis, given the significant
amount of energy used for heating, as evidenced by the January peak in each
year. We also see summer surges in
energy consumption, usually driven by increased vehicle miles driven, and
cooling energy loads. None-the-less, in
looking at smooth line in Figure 6 below, energy use peaked prior to the 2007
recession and has since rebounded.

Figure 6 – Primary Energy Consumption
Going forward, this will be an important factor to track, to
see if energy consumption flattens out or heads down.
H. Primary Energy Consumption Remains Below 2007 Peak
On an aggregate basis, total primary energy consumption
in the United States has not reached the pre-recession level, as illustrated in
Figure 7 below. The rebound has occurred
off the lows from 2009 through 2012. It
is not likely that we will see a pull-back in the economy until we see energy demand
move up, creating upward pressure on production and pricing, creating an
inflationary cycle. This belies the
importance of tracking energy costs going forward and their tie to inflation
and associated tempering of economic activities associated with increasing
interest rates and commodity prices.
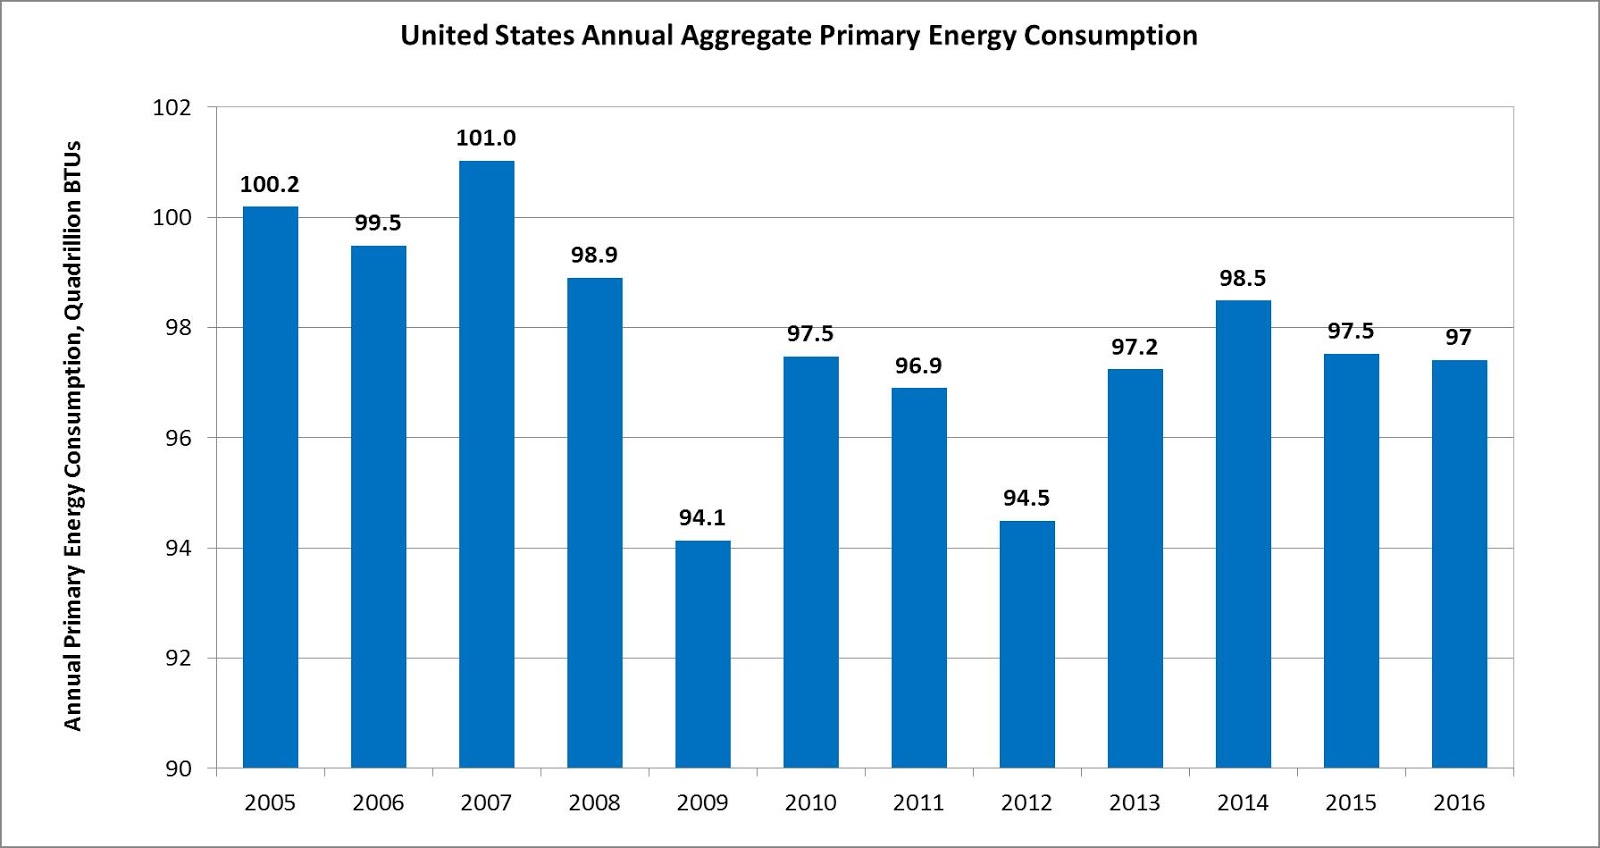
Figure 7 – Annual Primary Energy Consumption
I. Oil Prices Slightly Rebounding Off Historic Lows
Oil Prices soared prior to and into the middle of the
2007 recession. After peaking at over
$120/barrel in July, 2008, oil prices collapsed, falling to less than
$40/barrel within seven months, by January, 2009. Since that time, oil prices rebounded sharply
to over $100/barrel, for about three years, and then have settled back down to between
$30 and $50 per barrel.
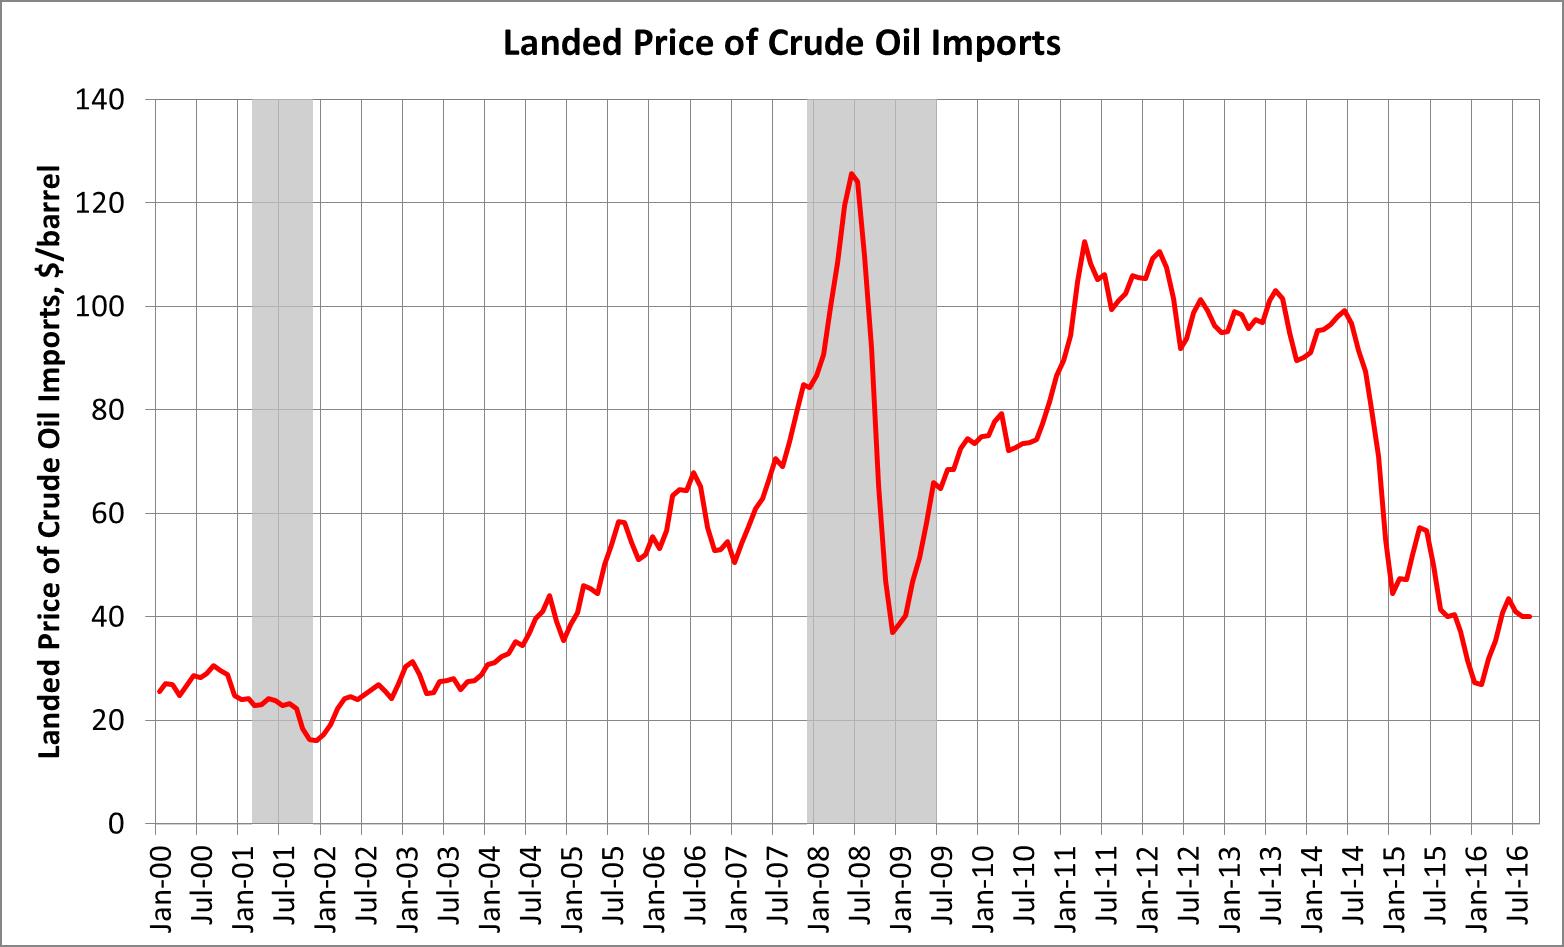
Figure 8 – Landed Price of Oil Imports
Oil prices remain strongly tied to economic downturns, with
rising oil prices implicated in five out of the last six recessions. The quick recovery of oil prices in the
period from January, 2009 to March, 2011 is truly remarkable, and would, based
on prior patterns, presaged another economic downturn. As it was, however, the $100 per barrel oil
price was not sustainable, and we have since seen a drop to a range between $30
and $50 per barrel.
Low oil prices are a boon to the economy. We will likely not see an economic downturn
until such time that the demand for energy increases, and oil prices move up. The current relatively low level of energy
prices presages a period of stable economic activity.
J. Natural Gas Prices
Natural gas prices have exhibited price patterns
similar to oil, rising to over $12/MMBtu by July, 2008 in the early stages of
the recession. Natural gas prices have
since trended much lower, currently trading around $3/MMBtu.
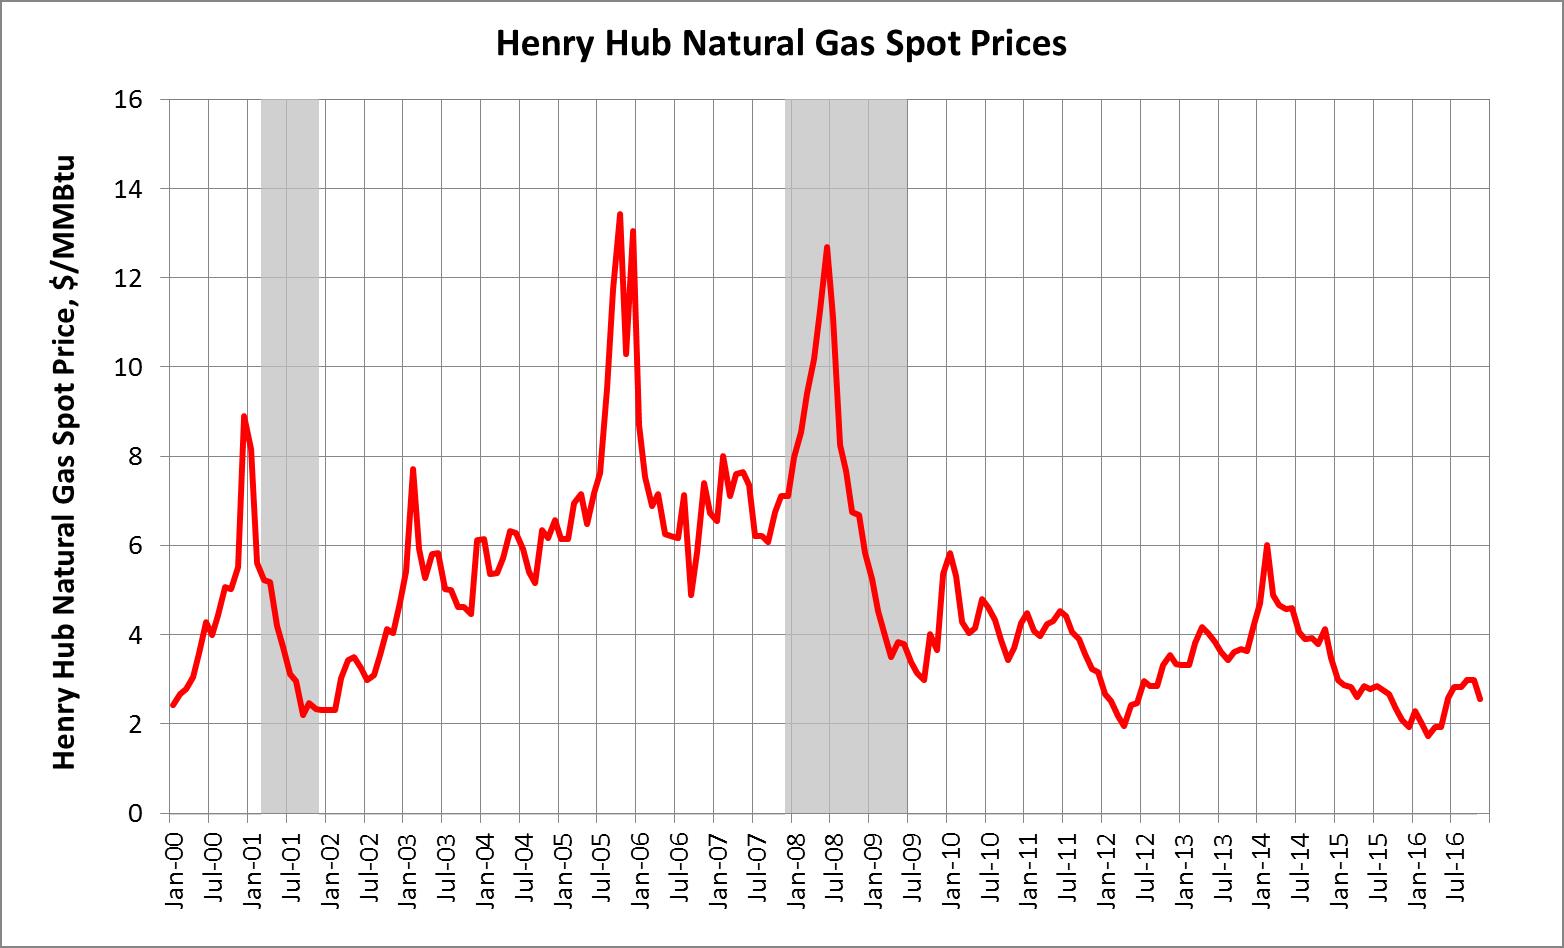
Figure 9 – Henry Hub Natural Gas Spot Prices
Low oil and natural gas prices have been a significant
benefit to the economy. These low prices
have been due to a slowdown in the economy, coupled with a market awash in both
oil and natural gas with the advent of advanced fracking technology, as well as
reduced global demand.
Both of these factors are important to track going
forward. With both oil and natural gas
prices at historic lows, we are likely to see these prices move up with
increasing economic activity placing upward pressures on pricing. Higher prices will have a negative effect on
economic activity and will correlate well with an overheating economy. Low oil and natural gas energy prices show
the continued impact of strong domestic supply associated with the fracking
boom as well as continued weakness in the demand side of the market.
K. Health Care Expenditures Rising
Health care prices in the United States continue to
rise faster than the overall economy, as seen in figure 10 below, placing a
greater burden on the United States economy.
The annual growth rate in health care expenditures have come down
significantly in the past fifteen years, from an average growth rate of 8.1%
per year from 2001 – 2005, 5.1% in the period from 2006 – 2010, and 4.3% annual
growth from 2011 – 2015. The
implementation of the AVA has recently increased health expenditures, albeit
growth rates that remain half of what they were fifteen years ago.
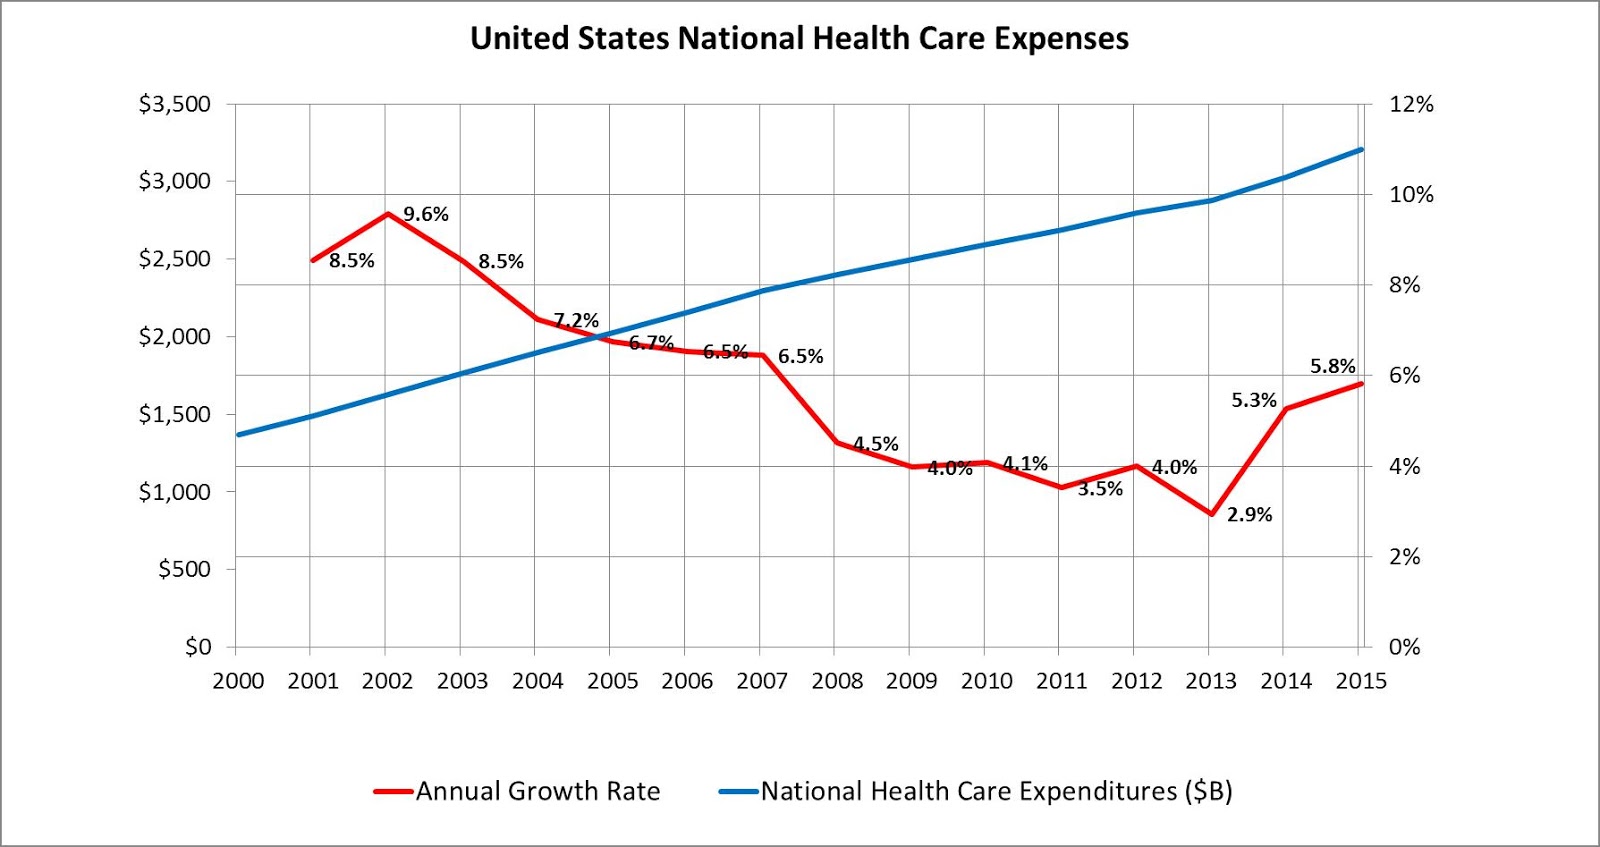
Figure 10 – National Health Care Expenditures
Health care expenditures place a burden on the economy,
constraining growth. As such, health
care costs are an important factor to watch going forward.
L. Federal Funds Rate
An important factor that impacts the level of economic
activity is the Federal Funds Rate. For
nearly a decade, the Federal Funds Rate has been kept close to zero, which has
been extremely beneficial to the economy.
Historically, the Federal Funds
Rate appears to be a good indicator for predicting recessions, as the feds typically
tighten rates as the economy heats up. Currently,
the Feds have just started tightening interest rates. It is highly likely that this tightening will
continue over the next few years, creating a headwind for the economy.
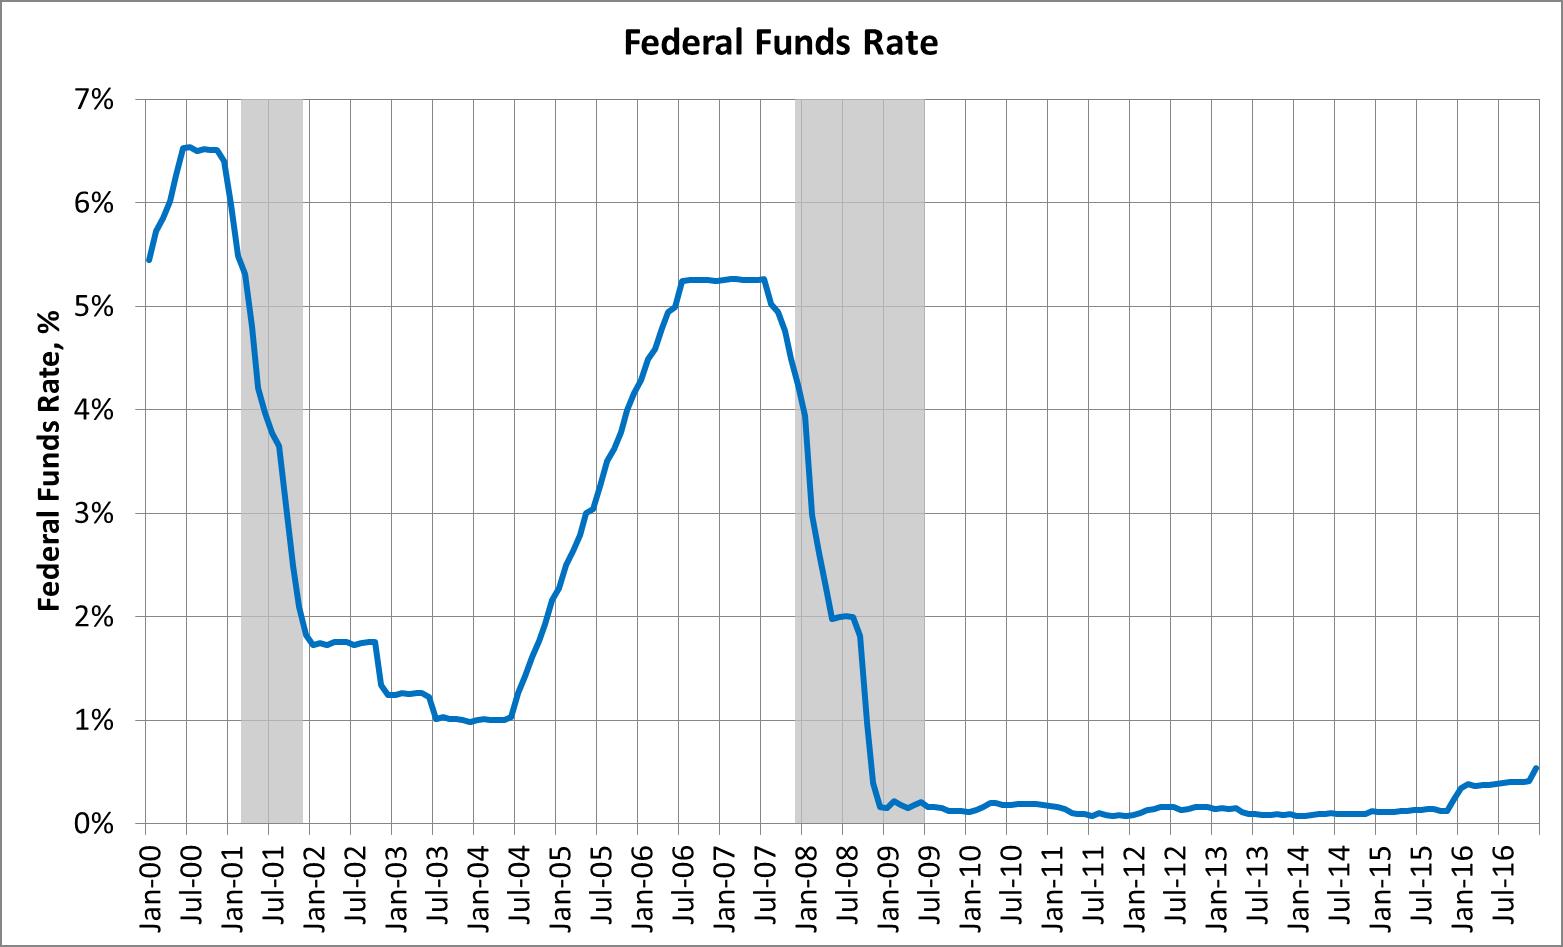
Figure 11 – Federal Funds Rate
M. Tell-Tale Recession Indicator Shows Economic Downturn Not Imminent
The difference between long term and short terms
interest rates is a very good recession indicator, which is illustrated in
Figure 12 below. It can be observed on
the chart that the spread is trending towards an economic slowdown, although it
could be several years before it gets there.
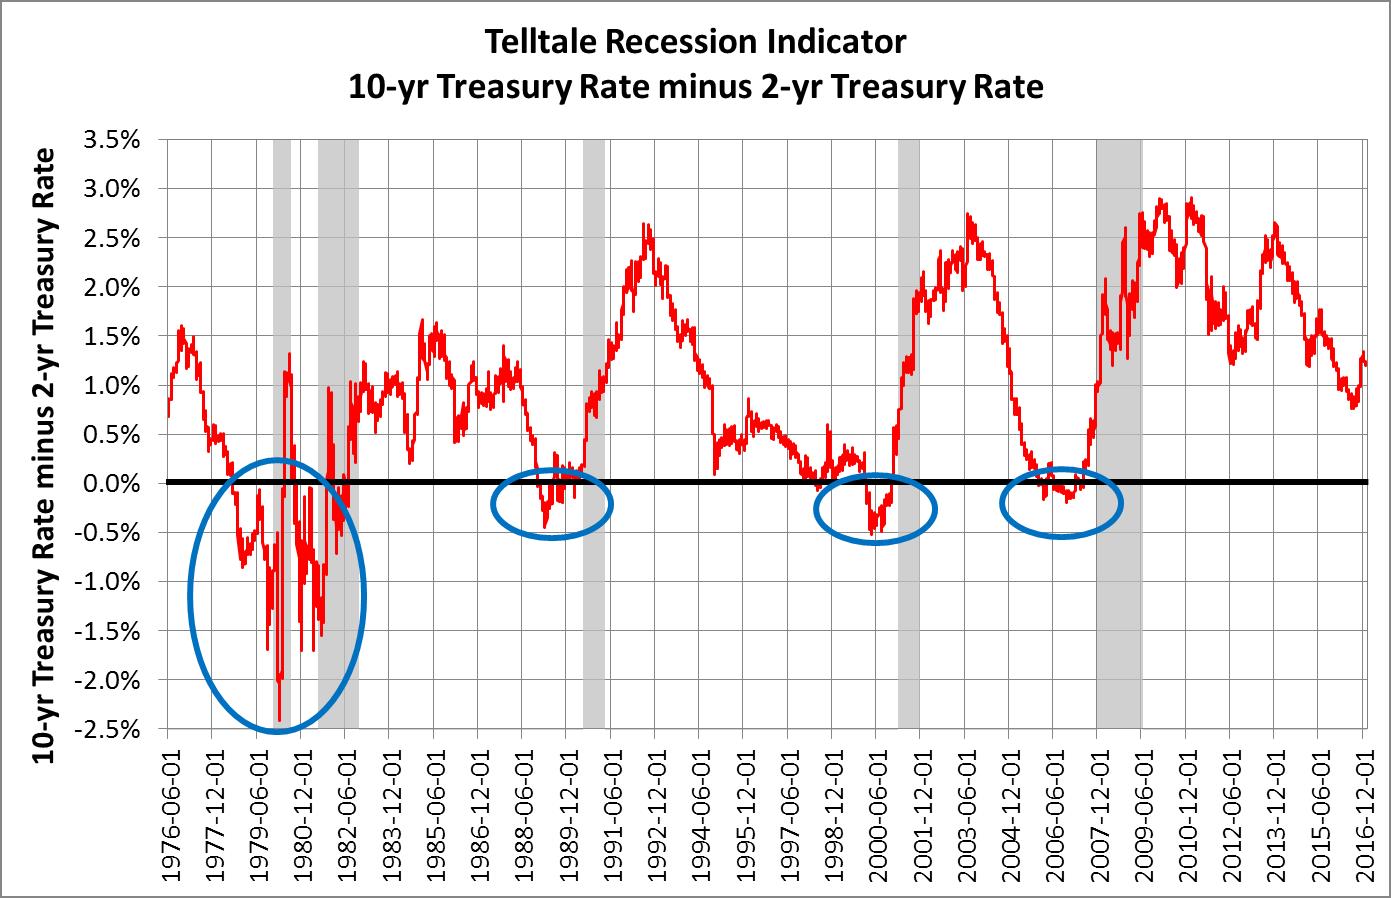
Figure 12 – 10-yr Treasurer Rate minus 2-yr Treasury
Rate
Interest rates are a critical factor in understanding
the status and strength of the economy, and we are likely not to see a downturn
in economic activity unless and until we see the spread between long term and
short term interest rates collapse. It
would appear that this index, once it falls below zero, predates a downturn by
about eighteen months as illustrated in the last five downturns.
Given the current weakness in the economy, it does not
appear that negative spreads will be realized in at least the next two years,
and that a downturn therefore is not likely until at least the latter half of 2019
at the earliest.
1 comment:
interesting overview of some of the basics. I like the 'miles driven' chart which shows people are on the move again. No word, though, on the issue of escalating debt - every incremental dollar of debt results in less than a dollar in incremental GDP.
Post a Comment