Setting growth targets is easy - achieving growth targets is difficult. Why aren't you hitting your growth targets? Many companies are challenged in achieving their growth targets, whether emerging enterprises or established businesses. Customer preferences shift, new technologies are introduced, regulations change. Competitors lower productions costs or increase performance and functionality, and new entrants introduce disruptive business models. For emerging enterprises, and established companies introducing new business units or products, the challenges of deciding what to offer, which customers to target, and how to successfully position against the competition is daunting.
A Leveraged Growth Strategy reduces uncertainty and creates organizational focus for developing and implementing successful growth strategies.
Have You Identified Your Most Important Unanswered Questions?
Developing a leveraged growth strategy begins with sweeping out the corners with your team and stakeholders, making sure that you have the right questions in front of your before you start looking for answers. The approach that is best to determine your critical questions is conducting an issues analysis. An illustrative issues analysis is provided below.
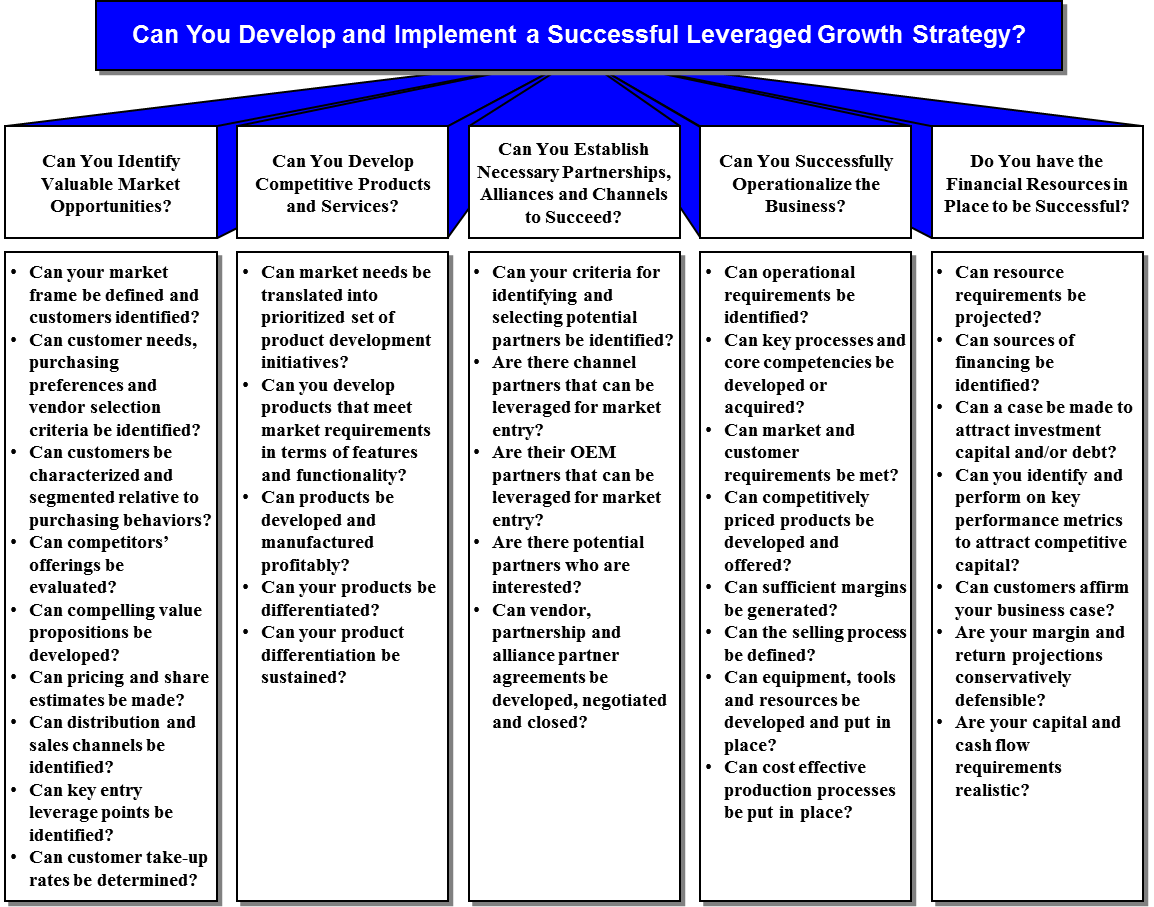
Issues analysis begins with brainstorming unanswered questions. Each member of a team independently writes down unanswered questions on sticky notes, and the sticky notes are placed up on a wall. The individual sticky notes are organized dynamically in two ways. First, they are grouped into like questions. Market questions are grouped together, finance questions are grouped together, operations questions are grouped together, etc.
Then the stickies are placed in hierarchies, with the higher order and broader questions grouped near the top, and subsidiary questions placed lower on the wall. Overlapping or duplicitous questions are removed, and remaining questions are consolidated.
Issues analysis consists of yes or no questions, with the requirement that all questions in the hierarchy have to be answered in the affirmative, starting at the lowest level and moving up. Only when all questions are answered in the affirmative will the single highest order question be answered in the affirmative.
The reason for preparing the issues analysis is to identify the key questions that have to be answered before you can have a growth strategy. It creates focus on critical questions and can be used as a check list for developing your organization's growth strategy.
Does Your Team Have Shared Ambitions and Objectives?
To successfully implement any strategy at the back-end requires buy-in and commitment to the objectives and process at the beginning. This is the strongest argument for frequent communication, and, more importantly, broad participation.
Ambition driven strategy is distinct and different from incremental strategy. Where does your organization want to be in five years? What is your specific vision for your organization? Begin with a draft vision, and work it really hard with your leadership team to determine the specific picture of where you want to be in five years. The vision is defined by very specific metrics, such as the number of customers, the mix of customers, revenues, number of products and services offered, the scale of the organization in terms of employee count, scale and type of plant and equipment, and operating earnings and profits.
Once the five year vision of your organization is well defined and agreed to by the leadership team, you can then connect the dots, assessing how far your existing products and services will get you to your five year target. The gap in your revenues forms the basis and reason for putting in place a leveraged growth strategy.
Do You Have A Process to Prioritize Growth Opportunities?
This next phase is the core of developing a leveraged growth strategy. Prior to getting deep into brainstorming and characterizing specific growth opportunities, the first step is to define your opportunity evaluation criteria, considering both fit criteria and attractiveness criteria.
Attractiveness criteria is focused on the market-facing opportunity, separate from your company. It is looking at markets as anyone would look at markets. Criteria is used for comparing market opportunities, in order to rank order your specific market opportunities. The objective is to identify four to six specific opportunity attractiveness criteria. Illustrative criteria include market size, market growth rate, profitability, competitive intensity, ability to reach, etc.
Fit criteria is absolutely necessary for developing a leveraged growth strategy. The fit criteria is focused on criteria specific to your organization's leverageable assets, competencies and capabilities, and your goals and objectives. Setting fit criteria is what distinguished this process from other strategy development processes.
The challenges of entering new markets are quite severe, and require entering with all of the competitive advantages as possible. This includes entering markets with which you bring specific skills and competencies along with you. If you enter a market, and establish a new business opportunity that is too far off your core competencies, your likelihood for success is extremely low, no matter how attractive the market opportunity might be.
During the nineteen-nineties, utility companies, faced with deregulation, began entering competitive markets, including cable television. Cable television was originally considered very similar to the utilities' core businesses, namely pipes and wires. At the end of the day, however, the cable business has a huge customer service component, with frequent changes to service offerings and very frequent customer contacts. This level of customer interactions was completely different business model than the regulated utility business, and utilities exited the business.
Setting the fit criteria begins with listing you strengths, unique competencies and capabilities. Illustrative fit criteria includes leveraging strengths, achieves growth objectives, provides opportunity for sustainable competitive advantage, achievable within certain capital and cash flow boundaries, etc.
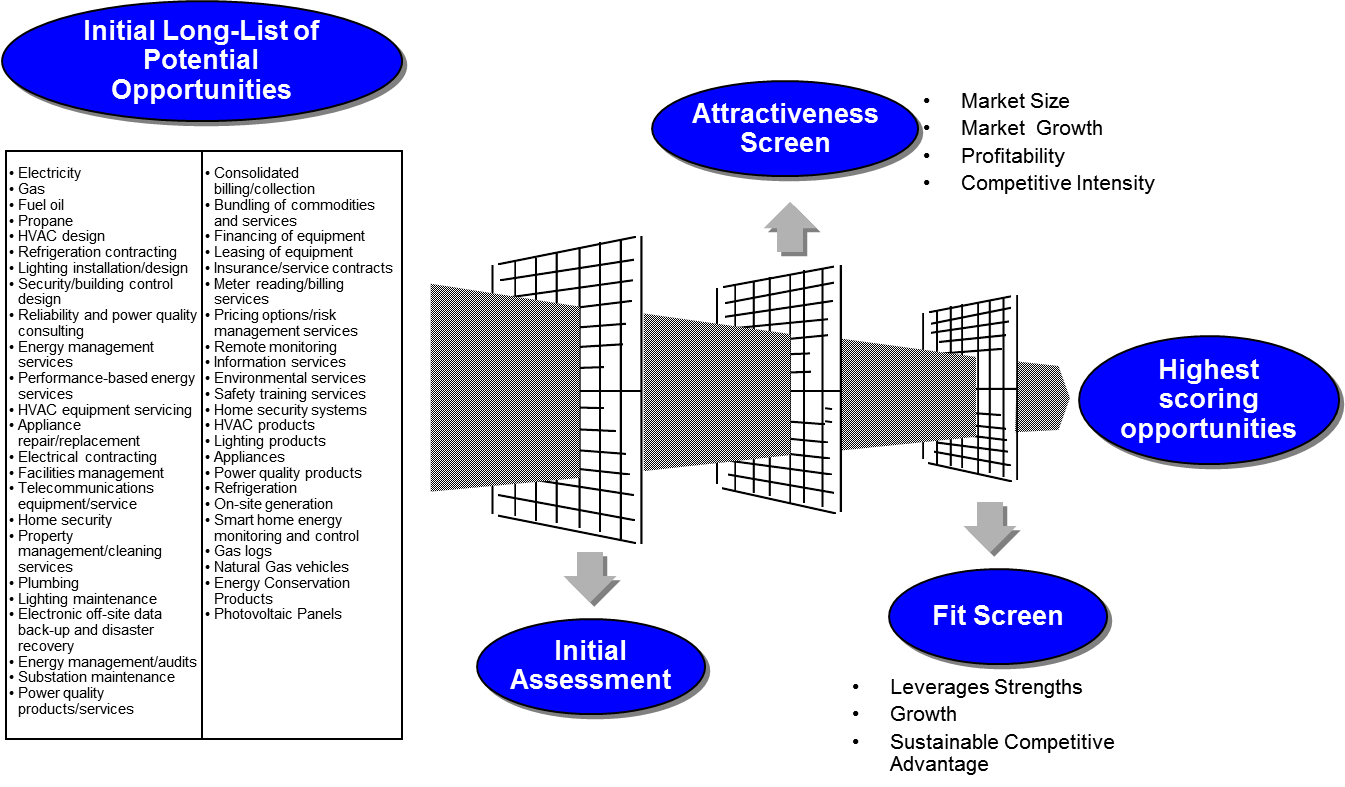
The screening process begins with conducting an open brainstorming process with your team. No idea is to be discounted at the outset. It is important for each opportunity to be sufficiently defined and characterized, so that all members of the team understand what the opportunity is. Each opportunity needs a name and a brief characterization.
The first screening is a very high level screening to assess the broad test for sanity and the alignment with the company's overall strategy. This screening may reduce the number of opportunities by one-quarter to one-third, for example. It is really just a reasonableness screen.
Once the initial screening is complete, the remaining opportunities need to be characterized, in short order and on a preliminary basis, with respect to the fit and attractiveness criteria. This can usually be done in a table format, in a matrix of the opportunities matrixed against the fit and attractiveness criteria. The task can be assigned to multiple team members in order to spread the work requirements and facilitate the process of filling out each spare in the matrix.
The next step is the assignment of numerical scoring values for each opportunity by each fit and attractiveness criteria. The purpose for scoring is to distinguish between opportunities. Absolute precision is not needed nor called for at this stage. The scoring shall use numbers between the values of one and five, with five representing the highest value, indicating the highest relative fit or the highest relative attractiveness.
In addition to the scoring system, each of the criteria can have overall weighting. This is not always necessary, and is usually called for when criteria are significantly more or less pertinent or valuable when compared to other criteria. One way to weight specific criteria is to simply apply a numerical value associated with each criteria, between the value of 0.8 for a low weighting, and 1.2 for a high weighting.
Once the scoring criteria have been applied for each opportunity, the average score can be determined for each opportunity, one average number for the fit criteria for each opportunity, and one average number for the attractiveness criteria for each opportunity.
Can You Identify Your Highest Priority Growth Initiatives?
Charting your growth opportunities on an attractiveness-fit chart helps understand your highest priority growth opportunities. Typically, the opportunities in the top right quadrant, those with the highest fit and the highest attractiveness, are those you want to focus on. In addition, those that are attractive from a market perspective, yet may not have the highest fit, can also be part of your growth strategy, as those with slightly lower fit scores can move up on fit, as long as you commit to making certain investments in those opportunities. For example, if a specific business opportunity requires a call center, and you have no call centers or call center experience, you have the opportunity to acquire a call center business, which would increase the fit of the business opportunity substantially.
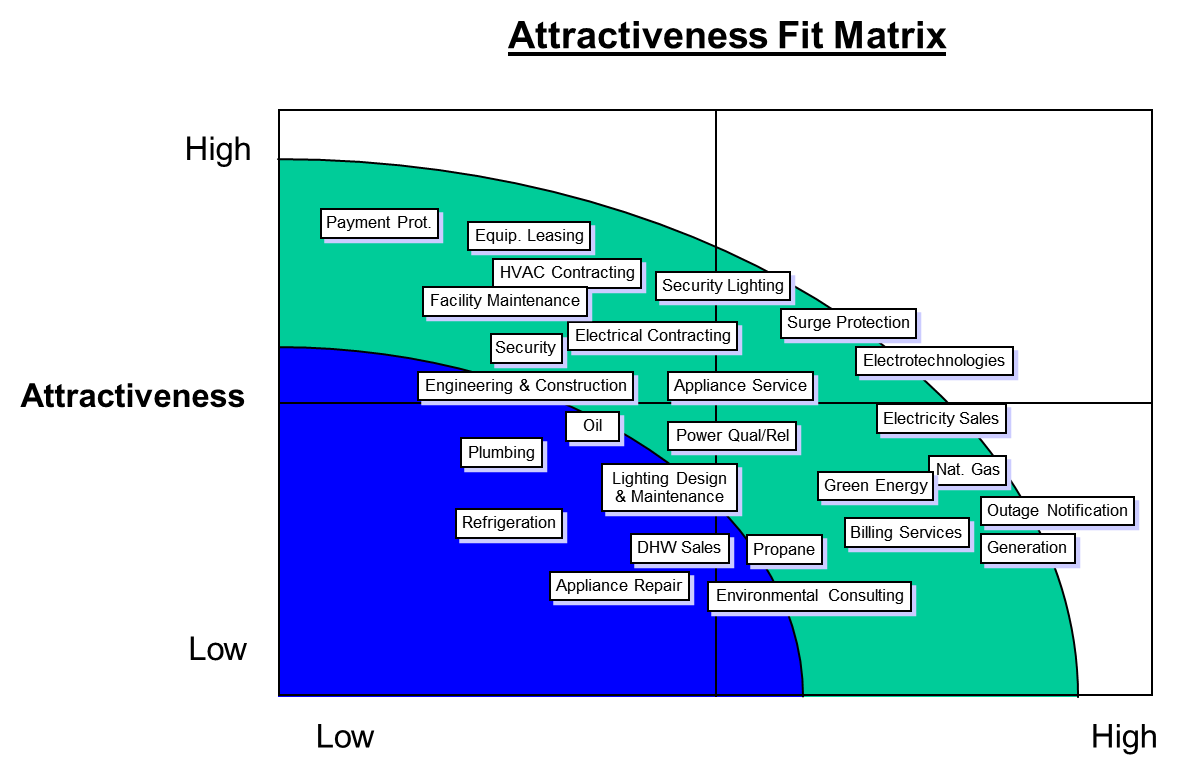
At this stage in the process, you and your team can select those opportunities you want to develop a cohesive and compelling strategy and business case.
Can You Make Cohesive and Compelling Business Case?
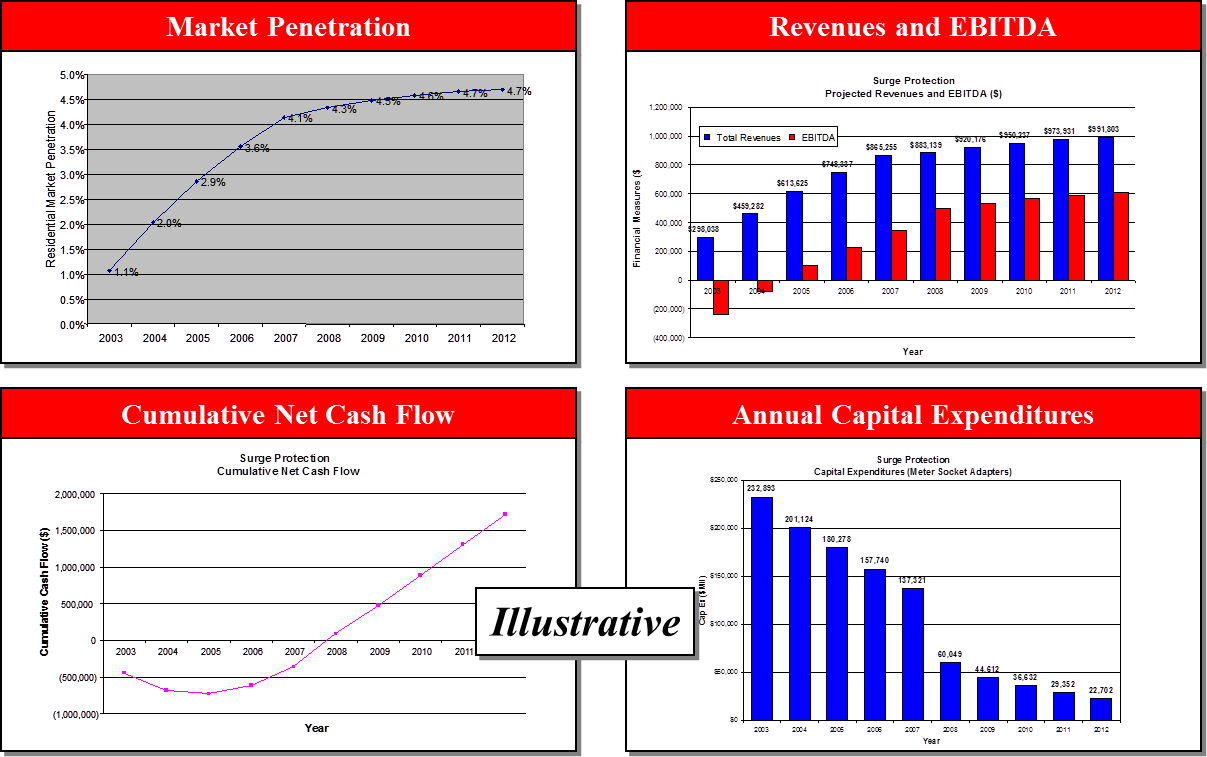
With a refined set of selected opportunities, you can integrate the opportunities into a single business strategy for growth. Preparing the strategy requires developing business plan summaries for each initiative, including financial projections. The business case for your growth strategy needs to include an assessment of the market, the products and services offered, customers and market segments targeted, the sales process and plan, the source of competitive advantage and differentiation, the channel and partnering strategy, the infrastructure, business processes and plant a equipment that is required, a staffing plan, a risk analysis and mitigation plan, competitive analysis, a financial plan, and a milestone and performance metrics schedule.
Can You Operationalize the Business?
The final stage is implementation. Once approvals are in place to go forward, a detailed action plan helps keep the implementation plan on time. All the details associated with putting a business in place have to be understood in advance, with key roles and responsibilities assigned for implementation, including timelines and due dates.
Post Script - If you want a PDF copy of my Leveraged Growth post, send me an email request to brad(at)velerity.com, and I would be pleased to send you a copy.

