Tuesday, April 9, 2013

Trade Deficit Narrows while Labor Force Participation Drops To Levels Not Seen Since 1979!

Two pieces of economic data stood out this week.  On a favorable note, the United States trade deficit narrowed by 3.4% from January, to $43 billion, with exports climbing to near record levels.  Exports rose to  $186 billion, with strong exports of energy products and automobiles.  Imports were little changed, with crude oil imports at their lowest levels since March, 1996.

Energy plays a central role contributing to the reduction in the deficit, with energy exports increasing on one hand, and energy imports at their lowest level in 17 years.  The reduction in crude oil imports is occurring for several reasons.  As referenced in an earlier blog on transportation, the number of vehicle miles driven has been reducing for several years, at the same time that vehicle efficiency has been going up.  In addition to reduced oil consumption for transportation, the United States has been incrementally increasing our own production of oil domestically.  These two factors have contributed to dampen and reduce the need and demand for crude oil imports.  


Another piece of economic news which stood out this week is the continued reduction in the overall labor force participation rate, explaining for the corresponding reduction in the nation's unemployment rate.  The labor force participation hit 63.3% in March this year, a level not seen since 1979.  Labor force participation peaked in 2000 at 67.3%, and has been declining ever since.

There is some uncertainty as to the cause of the reduction, with some referring to baby boomers leaving the work force, while others are giving up on being active in the job market, choosing to return to school, or stay on the labor force sidelines.  A structural shift appears to be taking place in the economy relative to the labor force.  The types of jobs being offered have transitioned to lower wage jobs and part time jobs.  Many who are unemployed are dragging their feet in taking  less attractive or part time positions.  We have seen higher wage manufacturing jobs being replaced with lower wage service sector jobs.  In addition, we have been seeing governments at the national, state and local levels reducing their employment levels.

There is another factor impacting the labor force.  Corporations, in order to maintain or improve profits with increased costs for energy, are turning to counterbalancing labor force reductions, substituting capital investment in improved productivity while simultaneously outsourcing lower margin activities.  These moves have allowed corporations to maintain or improve earning under scenarios with increased energy costs, leaving the labor force behind.    


Sunday, March 31, 2013

Number of US Natural Gas Rigs Drops 73% in Last Four Years - Oil Rigs at 10 Year High

Rig counts for natural gas are at the lowest level in the past 10 years, while oil rigs are at a 10 year high.  There are some that may consider the boom in natural gas fracking to be a bubble, but the bubble has already burst as seen in the chart below, with natural gas rigs dropping 73% in the past four years.  Oil rigs, on the other hand, are rocketing in the opposite direction, with rig counts rising 225% in the past four years.  


The rate of capital formation for investing in natural gas fracking is correlated with the expected returns, driven by natural gas prices.  Natural gas prices hit peaks of around $10 per thousand feet both in late 2005 and mid-2008.  Over that period of time, up until the great recession, natural gas rig counts continued to climb, reflecting strong investor sentiment on the expected returns available from natural gas fracking.

With the recession taking hold in late 2008, natural gas prices plummeted, dropping 71% over a a 9 month period.  As the recession played out, natural gas prices recovered, a little bit, but the result on rig counts, i.e., capital investments in drilling, also dropped precipitously over the same period of time.

A second precipitous drop in natural gas prices also took place in the period from January, 2009 to April, 2012, when natural gas prices dropped 67% from $5.69 to $1.89 per thousand cubic feet.  This further has put a restraint on the investors' appetites for investing in natural gas drilling with the rig count currently at 423 rigs.  It can also be seen that natural gas prices have recovered somewhat over the past 12 months, increasing approximately 65% off their lows.  It is expected that expanding investments in natural gas drilling will require natural gas prices of $5 or more, which is expected to be seen in the next year or two.

Oil rig counts have seen a phenomenal increase in the past four years.  This is expected to remain at a high level for several years, as oil prices remain stubbornly high, and provide sufficient incentive for investors to continue pouring capital into drilling activities.  Already, domestic crude oil production exceeds crude oil imports, and, when combined with reductions in domestic oil demand, may at some point return the United States to a net oil exporter.

Friday, March 29, 2013

Electric Car Sharing Service Comes to Paris, Lyon and Villeurbanne - Aggressive Expansion Planned


Back in 2010, the Mayor of Paris, Vincent Charbonnier issued an rfp for an electric car sharing service in Paris.  The plan is to put in 3,000 electric vehicles and 1,120 charging stations.  The contract was won by a French industrialist, Vincent Bolloré, apparently due to his offering the lowest rental charges for the users of the car sharing service.


What is unique about the Autolib, which the service is called, is that it is the first large scale electric only car sharing service, and that Mr. Bolloré is deploying his company’s innovative battery technology, called a lithium-metal polymer (LMP) battery.  This type of battery is considered safer that Lithium-ion batteries, because they do not overheat when charging and discharging.  The challenge with these batteries, however, is that they do require to be heated in order to function optimally, which requires additional electricity.  Apparently Mr. Bolloré’s company has spent close to $2 billion on battery development since 1996.

What is also unique about Mr. Bolloré’s plans is the electric car itself, the Bluecar, which, in addition to the car sharing service, is being offered for sale for $15,695.  He is following Shai Agassi’s model of leasing the battery pack, and here’s the deal:  the lease is $105 per month, with unlimited mileage.  The car’s characteristics are as follows:

  • Four seats
  • 155 mile range
  • Speed of 75 mph


Thursday, March 28, 2013

Oil Price Spikes Cause Recessions

Each recession in the last forty years in the United States was presaged by a sharp run-up in oil prices, seen in the chart below.  Sustained high oil prices also hold the economy back, which we are experiencing now as in the early 1980s.


High energy prices have effects that ripple through our economy, extracting cash from household incomes and corporate profits. In years past, the United States much more significant market power in oil markets compared to today.  When oil prices shot up in the late seventies, the United States reduced demand by switching to more efficient automobiles (Toyotas and Hondas significantly increased market share during this time - that's another issue), shut down oil fired power plants, and improved home and business energy efficiency.

As a result, oil consumption in the United States fell by 16.8% between 1978 and 1983.  This drop in United States demand had an impact in tempering global demand for oil, reducing the prices that oil companies and exporting countries could charge.  It also helped that OPEC countries were all competing to sell more oil, and that European countries also reduced their oil consumption in similar proportion to the United States.  This led to a world awash in oil, leading to lower energy prices, giving the economy a boost to recover in President Reagan's second term.

Currently, the United States is consuming approximately 10.2% less oil in 2012 compared to the country's peak oil consumption in 2005, according to data from the United States Energy Information Agency.  Unfortunately, the high prices that the world has been experiencing for several years, appear to be new oil price plateaus.  Global demand is very high for oil, with supplies tight.  The United States is going to have a very difficult time influencing the supply and demand balance going forward.  This circumstance is unfortunate for our economy, as we are continuing to experience the slowest economic recovery since the great depression.

In addition to high oil prices, there are other economic factors tat are holding our economy back.  One is the de-leveraging of household and commercial debt.  Second is a housing market retrenchment that we are just now coming out of.  For more on the hosing market turnaround, see my earlier post here.  Third is a business climate that is not seeing a lot of demand, and is favoring cash over capacity additions and hiring.

In the United States, people are making economic decisions in response to high oil prices. As explained in an earlier post on transportation, the United States hit peak oil consumption in 2005, and we are now consuming oil at a level that is approximately 10.2% below our historic peak.  This has been accomplished principally by driving fewer miles, and driving more efficient vehicles.

Without oil and natural gas fracking, we would be in a recession, referred to as a double dip.  Although natural gas prices have increased 65% in the past year, as seen in my natural gas post here, there still remain near historic lows.  Without the significant cost reduction in natural gas, I believe very strongly that we would very likely be back in a recessionary economy.

Going forward, the stars are aligning to keep the economy moving forward, perhaps even at an accelerating pace.  These include continued relatively strong job growth in the past 6 months, a surge in new housing starts and a strengthening market for existing homes, extremely favorable natural gas prices, a stock market that continues to perform at market peaks, continued low interest rates and further injections of capital into the market by the United States Federal Reserve.

All is not blue sky and sunny, as fundamental factors impeding long term economic growth will continue to exert significant headwinds on our economy going forward.

Monday, March 25, 2013

Metal-Air Batteries May Replace Lithium-Ion as the New 'It' Battery Technology - Although Significant Challenges Remain

New technical innovations in metal air batteries may place this technology in a position to replace lithium-ion batteries as the new 'It' battery for grid storage and electric vehicles.  Several companies are announcing new breakthroughs that address the long term issues associated with metal air batteries.  Metal air batteries work by oxidizing the metal surfaces, using oxygen.  Common metals used in metal air batteries include aluminum, zinc, lithium and iron.  Commercially available batteries include zinc-air batteries, which are used in hearing aids and pagers.  Due to the difficulties in recharging, currently available zinc-air batteries are single use batteries.

One company, Phinergy, is developing an aluminum air battery to provide electric cars with 1,000 mile range.  Here is a company video that explains the technology:


One of the companies that is advancing the technology is Fluidic Energy, based in Scottsdale, Arizona.  Fluidic is targeting the backup power market for telecommunications, which currently is dominated by diesel generators and lead acid batteries.  Fluidic is also partially funded by the United States Department of Energy, raising $5.13 million in 2009, and ARPA-e, raising close to $3 million.  More recently, it was announced in March, 2013, that Fluidic secured a Series B round of funding, although no mention of the amount raised can be found.  This is in addition to a company regulatory filing in January, 2011 that stated a capital raise of $17.3 million.

The advantage of metal-air batteries is the significant amount of energy stored, with upwards of three-to-four times as much energy stored as compared to lithium-ion batteries.  This offers great promise, although the key challenge has been the difficulty in the ability to recharge the batteries.  In addition, it is also rarely mentioned that metal air batteries also have low round trip efficiency, perhaps as low as fifty percent (50%).

Some of the companies that are active in developing metal air batteries include:

Saturday, March 23, 2013

Critical Role of Natural Gas in Meeting Electricity Demand with Intermittent Wind and Solar Resources

Natural gas is playing an increasingly critical role in keeping grids stabilized around the world with increasing penetration of intermittent wind and solar powered generation sources.  Even with the advantageous cycling available with natural gas power plants, however, many grid operators are implementing additional grid stabilization strategies including Power Curtailments, Negative Energy Pricing and Electricity Trading, in addition to available hydro pumped storage and run of river strategies.

In 2012, wind powered generation met thirty-five percent (35%) of the generation resources called upon in Denmark, and contributed a maximum forty-five percent (45%) in September.  From a capacity perspective, Denmark's wind turbines hit a capacity level greater than the country's peak requirement, 3.8 GW wind production versus 3.5 GW demand on March 11, 2013.  In order to meet the variable production dynamic associated with wind power, the Danish grid operators implemented a series of tactics, including wide swings in electricity trading, both imports and exports, as well as calling upon dynamic dispatching of natural gas generation resources.  The Denmark grid has six interconnection points with European grids, facilitating their trade in electricity, supporting both system stability objectives and economic objectives.


In Germany, several notable data points have been achieved with solar power and wind power.  On May 25, 2012, Germany hit a peak in solar generation capacity of 22.15 GW, producing 189.24 GWh on that day, contributing fourteen percent (14%) of the country's total electricity requirement.  Germany added 1,008 new turbines in 2012, connecting an additional 2,439 MW in new wind capacity to the grid.

From a recent report by the Fraunhofer Institute, solar power plants produced 27.9 TWh in 2012, reaching a 5% share of the gross electricity production of 560 TWh.  Wind turbines produced a total of 45.9 TWh in 2012, reaching an 8.2% share of the country's gross electricity production.  Accordingly, solar and wind production together 73.8 TWh, representing 13% of the country's total electricity production.

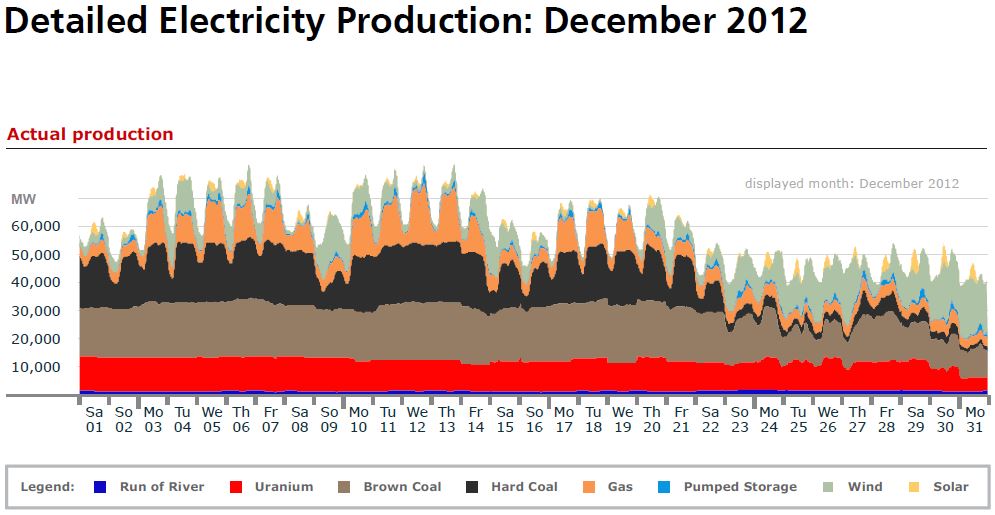
Also from the Fraunhofer report referenced above, the chart below provides details on Germany's electricity production for December, 2012.  One can observe in the chart the excessive variability in renewable energy resources, and the compensating for renewable intermittency by ramping both natural gas and hard coal generation resources, while essentially base-loading nuclear and soft coal resources.

It can be observed that natural gas is lower in the merit order loading for economic dispatch relative to coal and nuclear resources, and is called upon extensively to dynamically balance supply and demand.  


Thursday, March 21, 2013

Hearing March 22 on Massachusetts' Solar Program: Regulatory Changes to 225 CMR 14.00 RPS Class I

On Friday, March 22, 2013, the Commonwealth is holding two important hearings regarding the State's solar programs:

  1. Post-400 MW Solar Policy Development - In the morning, from 10:00 AM to 12:00 Noon, the State is holding hearings on the post-400 MW solar policy development.  A presentation relevant to this hearing is available here.  Information about the Hearing is available here.   
  2. Regulatory Changes to 225 CMR 14.00 RPS Class I - In the afternoon of March 22, from 1:00 PM to 3:00 PM, the State is convening hearings regarding the proposed changes to the laws regarding the solar carve out program.  Information about the Hearings and the Proposed Changes are available here.


NOTICE OF PUBLIC COMMENT AND HEARING

Notice is hereby given that the Massachusetts Department of Energy Resources (“DOER”), acting under statutory authority of Section 11F of Chapter 25A of the General Laws, and in conformance with Chapter 30A of the General Laws, is holding a public hearing on proposed amendments to portions of 225 CMR 14--Renewable Energy Portfolio Standard – Class I (“RPS Class I”). The RPS Class I regulations require all retail electricity suppliers selling electricity to end-use customers in the Commonwealth to obtain a specific minimum percentage of their electricity supply from renewable energy generation sources. The proposed amendments: (1) make strategic revisions to the Solar Carve-Out portion of the RPS Class I program to improve program design and address market concerns; and (2) make several other (non-solar) revisions to
likewise improve the RPS Class I program.

A public hearing will be conducted to receive verbal and written comments on the proposed regulations.

Location: Gardner Auditorium, Massachusetts State House, Boston, MA 02133

Date: March 22, 2013 from 1:00 to 3:00 PM

Verbal and written testimony will be accepted at the hearing; however, parties are requested to provide written copies of their testimony. Written comments will be accepted beginning on March 1, 2013 and ending at 5 pm on March 25, 2013. Please submit written comments to Michael Judge, via mail to the Department of Energy Resources, 100 Cambridge Street, Suite 1020, Boston, MA 02114, or electronically to DOER.SREC@state.ma.us. Copies of the proposed regulations may be obtained from the DOER website www.mass.gov/doer or by contacting Michael Judge at michael.judge@state.ma.us.

BY ORDER OF: 

Mark Sylvia, Commissioner
Department of Energy Resources.


Waxman/Whitehouse Carbon Tax Draft

Bicameral Committee introduced draft legislation for a carbon tax.  Below are links to the four key documents and the text of the summary one pager of the draft legislation.

Representative Henry A. Waxman, Senator Sheldon Whitehouse, Representative Earl Blumenauer, and Senator Brian Schatz released draft carbon-pricing legislation and solicited feedback on it from stakeholders and the public.  The legislation would establish the polluter pays principle for dangerous carbon pollution, requiring large emitters to pay for the pollution they emit.

The “discussion draft” contains a new and straightforward approach to putting a price on carbon pollution.  The nation’s largest polluters would have to pay a fee for each ton of pollution they release.  The legislation assigns responsibility for the assessment and collection of the carbon fees based upon the expertise that has already been developed by EPA and the Treasury Department.  Under the discussion draft, EPA’s database of reported emissions would determine the amount of pollution subject to the fee.  The Treasury Department would be responsible for the collection and handling of the fees.


The legislators are specifically requesting feedback on the following questions:

  1. What is the appropriate price per ton for polluters to pay?  The draft contains alternative prices of $15, $25, and $35 per ton for discussion purposes.
  2. How much should the price per ton increase on an annual basis?  The draft contains a range of increases from 2% to 8% per year for discussion purposes.
  3. What are the best ways to return the revenue to the American people?  The discussion draft proposes putting the revenue toward the following goals, and solicits comments on how to best accomplish each:  (1) mitigating energy costs for consumers, especially low-income consumers; (2) reducing the Federal deficit; (3) protecting jobs of workers at trade-vulnerable, energy intensive industries; (4) reducing the tax liability for individuals and businesses; and (5) investing in other activities to reduce carbon pollution and its effects.
  4. How should the carbon fee program interact with state programs that address carbon pollution?

Comments can be submitted by email to cutcarbon@mail.house.gov, with responses being accepted up to April 12, 2013.


  1. One Pager: "Tackling Climate Change and Raising Revenue for the American People, Carbon Pollution Fee Discussion Draft" (March 12, 2013).
  2. Section-by-Section: "Discussion Draft: Fee for Emissions of Carbon Pollution" (March 12, 2013).
  3. Backgrounder: "Carbon Pollution Fees: A New Workable Approach" (March 12, 2013).
  4. Bill Text: Discussion Draft of Carbon Pollution Fee (March 12, 2013).

Below please find the text of the one-pager summary:


Tackling Climate Change and Raising Revenue for the American People
Carbon Pollution Fee Discussion Draft

Carbon pollution from human activity is driving climate change, which is harming our economy, health, and environment. The United States is the second-largest source of annual carbon pollution and has contributed over one-quarter of the cumulative global carbon pollution from human activity. Scientists warn that we must act now to reduce carbon pollution to avoid potentially catastrophic consequences.
The carbon pollution fee program outlined in this discussion draft released by Congressman Waxman (D-CA), Senator Whitehouse (D-RI), Congressman Blumenauer (D-OR), and Senator Schatz (D-HI) will generate substantial revenue while reducing carbon pollution. The draft abides by the following principles:
          Polluting industries should be responsible for the harm they are causing to the American people.
          All revenue generated by the carbon pollution fee should be returned to the American people.
          Trade-vulnerable, energy-intensive industries should be protected.
Specifically, the discussion draft outlines a legislative framework that would:
          Establish a carbon pollution fee that applies to all six categories of greenhouse gases.
          Require large carbon pollution sources to pay the fee for carbon pollution permits based on the quantities of carbon pollution reported by the sources under the EPA’s Greenhouse Gas Reporting Rule.
          Create a program to be jointly administered by the Department of the Treasury and EPA. EPA would implement and enforce emissions reporting under EPA’s Greenhouse Gas Reporting Rule, and Treasury would assess, collect, and enforce the fee requirements at the point where carbon pollution is emitted or passed on to consumers, depending on the type of source.
This approach would:
          Drive significant carbon pollution reductions.
          Generate substantial revenue to be returned to the American people.
          Provide broad coverage of greenhouse gas emissions, while minimizing compliance and administrative burdens and utilizing each agency’s area of expertise.
Comments on any aspect of the discussion draft are welcome, and the lawmakers have identified the following key questions for feedback:
1.      What is the appropriate price per ton for polluters to pay? The draft contains alternative prices of $15, $25, and $35 per ton for discussion purposes.
2.      How much should the price per ton increase on an annual basis? The draft contains a range of increases from 2% to 8% per year for discussion purposes.
3.      What are the best ways to return the revenue to the American people? The discussion draft proposes putting the revenue toward the following goals, and solicits comments on how to best accomplish each: (1) mitigating energy costs for consumers, especially low-income consumers; (2) reduce the federal deficit; (3) protect the jobs of workers at trade-vulnerable, energy intensive industries; (4) reduce the tax liability for individuals and businesses; and (5) invest in other activities to reduce carbon pollution and its impacts.
4.      How should the carbon fee program interact with state programs that address carbon pollution?

Wednesday, March 20, 2013

United States Housing Market Turns the Corner - Is Poised for Significant Growth in 2013

All factors point to a very robust 2013 for the United States housing industry:

  1. As observed in the chart below, January housing for sale listings are 47% below their recent peak in July, 2010, and are at their lowest level since 1999;
  2. Job growth has averaged 205,000 over the past four months, adding 820,000 jobs to the economy, which underpins the housing market;
  3. Home construction has been extremely low for the past four years, limiting the available stock and supply of housing units;
  4. House values and the stock market have rebounded, essentially erasing household debts acquired during the recession; and
  5. Share of household income being used to pay off debt is at 10,6%, which is the lowest proportion of income in the past 29 years.
The coincidence of these factors bodes extremely well for growth in the housing industry.  One estimate expects new housing units to increase 40.8% from 2012 to 2013, increasing from 781,000 units to 1,100,000 units.  House prices have experienced their biggest year-over-year jump since May, 2006, according to the CoreLogic home price index, which increased 8.3 percent comparing December 2012 to December 2011.  The housing industry has turned the corner, and is expected to contribute 0.7% to the growth in the economy this year.


Sources:

  1. USA Today
  2. National Association of Realtors


Tuesday, March 19, 2013

United States Housing Starts Near Five Year High

United States single family housing starts roared ahead in February to four and one-half year high.  All indications are favorable for a solid recovery in the housing sector, including upward pressures on construction employment and sales of building materials.  In summary:
  1. February single family housing starts, at 618,000 units on an annualized basis, are at a 4 1/2 year high;
  2. Building permits in February increased 4.6% to 946,000, which is the most since June, 2008, and bodes well for future higher levels of construction activity;
  3. February 2013 housing starts represented a 31% growth over February 2012 housing starts;  
  4. Existing home prices in January, 2013, were 10% higher than January 2012, due to a strengthening economy;
  5.  There is a 13 year low in houses on the market for sale, further putting upward pressure on housing prices; and
  6. The outlook for sales over the next six months rose to its highest level in in more than six months.
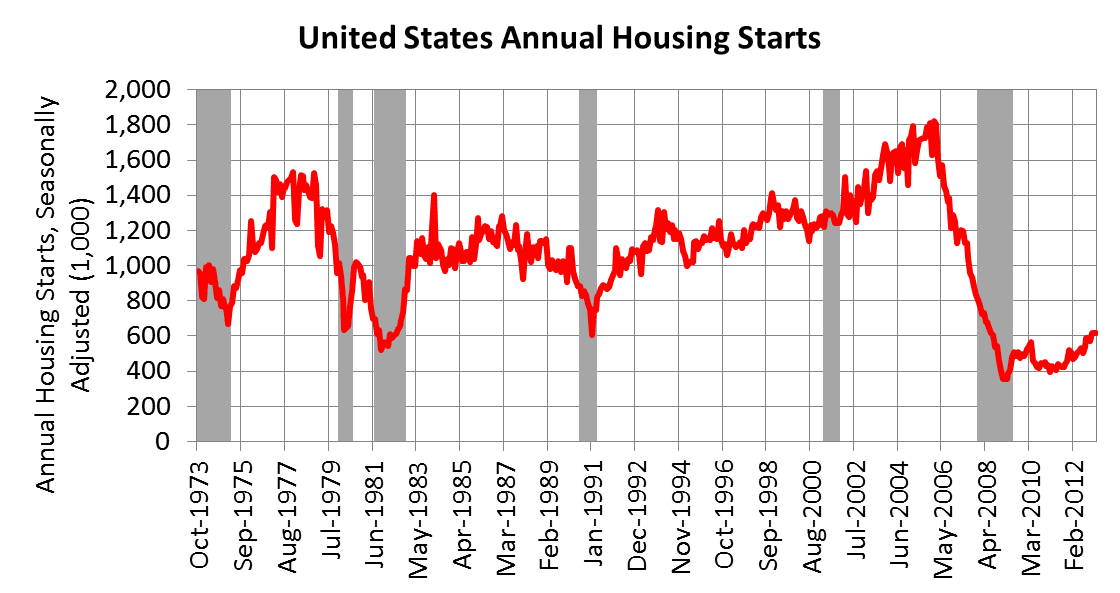
In the chart below, showing housing starts and recessions.  There are a few additional points that can be made.  Note in the chart below that housing starts dropped during the recession to their lowest level in decades.  The recent recovery in housing starts is fantastic from an economic perspective, but the starting point is so depressed, but housing starts have to grow by another 60% before reaching the long term average of close to 1,000 housing starts per year.  

It is also instructive to observe that precipitous falls in housing starts preceded four of the last five recessions.  We can also observe fairly steep housing start run-ups, representing overbuilding that gets out ahead of sustainable market levels.

Finally, one of the concerns noted by home builders, relative to their ability to meet increased demand, is their concern over having access to sufficient labor, land and materials.  Accordingly, it is likely we will see continued increases in construction employment over the next few years, which will be an important contribution to reducing unemployment.

Sources:

  1. United States Census Bureau, U.S. Department of Commerce
  2. Associated Press